Chennai Petroleum Corporation Q2 FY27 Results: Consolidated Net Profit ₹2,247 Crore on Total Income of ₹22,074 Crore
Earnings
petroleum refining
Blacklitt Research3 min read
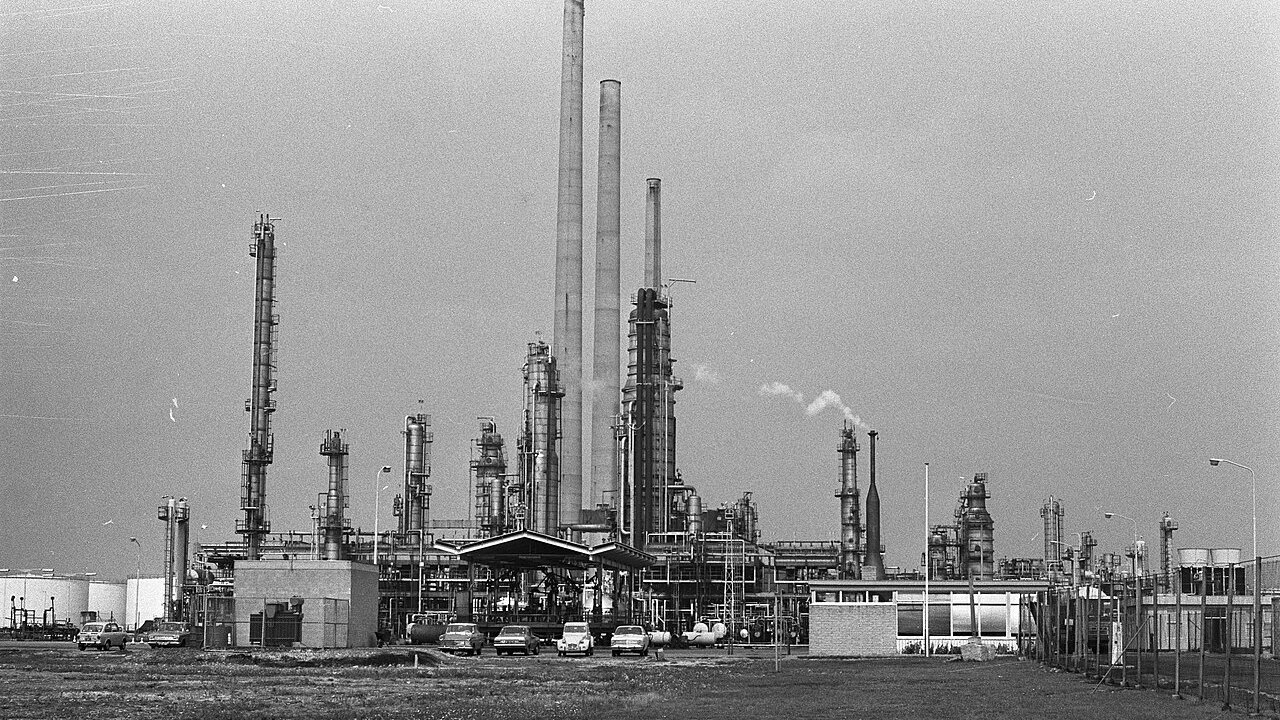
Hans Peters for Anefo, via Wikimedia Commons (CC0). Illustrative image.
Chennai Petroleum Corporation reported consolidated total income of ₹22,074.34 crore and net profit of ₹2,247.03 crore for the quarter ended 30 Sep 2026. On a standalone basis, total income was ₹22,109.22 crore and net profit ₹2,271.29 crore. The board approved the results on 22 Oct 2026.
Key highlights
Consolidated
Including its subsidiaries
Total income: ₹22,074.34 crore, up 10.2% YoY and down 24.9% QoQ
Net profit and EPS: ₹2,247.03 crore, up 212.4% YoY; basic EPS ₹150.90
Finance costs: ₹62.31 crore, up 83.5% YoY
Interim dividend: ₹25.00 per share; record date 30 Oct 2026
Standalone
The company on its own, without its subsidiaries
Total income: ₹22,109.22 crore, up 10.2% YoY and down 24.7% QoQ
Net profit and EPS: ₹2,271.29 crore, up 210.5% YoY; basic EPS ₹152.53
Other income: ₹53.77 crore, up 51.6% YoY
Interim dividend: ₹25.00 per share, payable on or before 21 Nov 2026
Summary
Consolidated ₹ crore
Particulars
Q2 FY27
Q2 FY26
YoY
Q1 FY27
QoQ
22,074.34
20,039.86
+10.2%
29,376.45
-24.9%
Revenue from operations
22,055.45
20,033.62
+10.1%
29,358.75
-24.9%
Other income
18.89
6.24
+202.7%
17.70
+6.7%
2,247.03
719.19
+212.4%
1,031.35
+117.9%
Finance costs
62.31
33.96
+83.5%
52.14
+19.5%
Depreciation
161.02
151.71
+6.1%
154.92
+3.9%
Tax expense
760.28
262.74
+189.4%
348.89
+117.9%
Net profit margin
10.18%
3.59%
+6.59 pp
3.51%
+6.67 pp
Tax as share of profit before tax
25.3%
26.8%
-1.48 pp
25.3%
+0.00 pp
EPS, basic (₹)
150.90
48.30
+212.4%
69.26
+117.9%
Figures are in ₹ crore; YoY compares with Q2 FY26 and QoQ with Q1 FY27. Click Total income or Net profit to see the rows behind them.
Consolidated net profit rose 212.4% year on year, faster than total income, which rose 10.2%. The net profit margin was 10.18% against 3.59% a year earlier. Revenue from operations rose 10.1%, slower than other income, which rose 202.7% to ₹18.89 crore.
Tax expense was ₹760.28 crore, or 25.3% of profit before tax of ₹3,007.31 crore, against 26.8% a year earlier. Profit before tax includes a ₹10.62 crore share of profit from jointly controlled entities and an associate; the filing says this share is based on unaudited financial information furnished by management.
Against the previous quarter, total income fell 24.9% while net profit rose 117.9%. The previous quarter's revenue included ₹385.21 crore of additional revenue from a retrospective petroleum price revision for March 2026 supplies, recognised in Q1 2026-27. The filing does not say what caused revenue from operations to move from ₹29,358.75 crore to ₹22,055.45 crore.
Note 5 gives the average gross refining margin for the quarter as US$20.41 per bbl, against US$9.04 per bbl a year earlier. The company says this includes an inventory gain of US$3.82 per bbl and excludes the ₹385.21 crore of prior-year price revision revenue.
Standalone ₹ crore
Particulars
Q2 FY27
Q2 FY26
YoY
Q1 FY27
QoQ
22,109.22
20,069.09
+10.2%
29,376.45
-24.7%
Revenue from operations
22,055.45
20,033.62
+10.1%
29,358.75
-24.9%
Other income
53.77
35.47
+51.6%
17.70
+203.8%
2,271.29
731.55
+210.5%
1,016.67
+123.4%
Finance costs
62.31
33.96
+83.5%
52.14
+19.5%
Depreciation
161.02
151.71
+6.1%
154.92
+3.9%
Tax expense
760.28
262.74
+189.4%
348.89
+117.9%
Net profit margin
10.27%
3.65%
+6.63 pp
3.46%
+6.81 pp
Tax as share of profit before tax
25.1%
26.4%
-1.35 pp
25.5%
-0.47 pp
EPS, basic (₹)
152.53
49.13
+210.5%
68.27
+123.4%
Figures are in ₹ crore; YoY compares with Q2 FY26 and QoQ with Q1 FY27. Click Total income or Net profit to see the rows behind them.
Standalone net profit was ₹2,271.29 crore, up 210.5% year on year and ₹24.26 crore higher than consolidated net profit. Standalone total income was ₹22,109.22 crore, ₹34.88 crore higher than the consolidated figure.
Standalone other income was ₹53.77 crore, or 0.2% of total income, against ₹35.47 crore a year earlier. The consolidated other income is ₹18.89 crore. The filing does not explain the difference between the two bases.
Standalone tax was 25.1% of profit before tax, against 26.4% a year earlier, and the net profit margin was 10.27% against 3.65%.
The board declared an interim dividend of ₹25.00 per equity share of ₹10.00 face value for FY 2026-27. The record date is 30 Oct 2026 and payment is due on or before 21 Nov 2026. Dividends paid in the six months to 30 Sep 2026 were ₹804.12 crore in the cash flow statements.
Inference
The interim dividend is ₹25.00 per share. The filing does not state the total payout. Paid-up capital of ₹148.91 crore at ₹10 face value implies about 14.89 crore shares, so the payout would be about ₹372 crore. That figure is an estimate worked out here, not a number in the filing.
The auditors issued unmodified opinions on both sets of results. Their other matter paragraph says the company did not have the minimum number of independent directors, including one woman independent director, during the period, and the opinion is not modified for this matter.
The filing does not say why revenue from operations fell in the quarter, why net profit rose, why consolidated other income is lower than standalone, or when the independent director requirement will be met.
Create a free account to read the rest of this article and the analysis that follows.
By continuing you agree to our Terms and Privacy Policy, and to receive updates from Blacklitt by email. You can unsubscribe anytime.
Disclaimer:
The information available on this article is provided for education and informational purposes only. It does not constitute or provide financial, investment or trading advice and should not be construed as an endorsement of any specific stock or financial strategy in any form or manner. We do not make any representations or warranties regarding the quality, reliability, or accuracy of the information provided. This website may contain links to third-party content. We are not responsible for the content or accuracy of these external sources and do not endorse or verify the information provided by third parties. We are not liable for any decisions made or actions taken based on the information provided on this website.


 CHENNPETROChennai Petroleum Corporation Ltd.