Himadri Speciality Chemical Q2 FY27 Results: Consolidated Net Profit ₹231 Crore on Total Income of ₹1,733 Crore
Earnings
Chemicals
Blacklitt Research4 min read
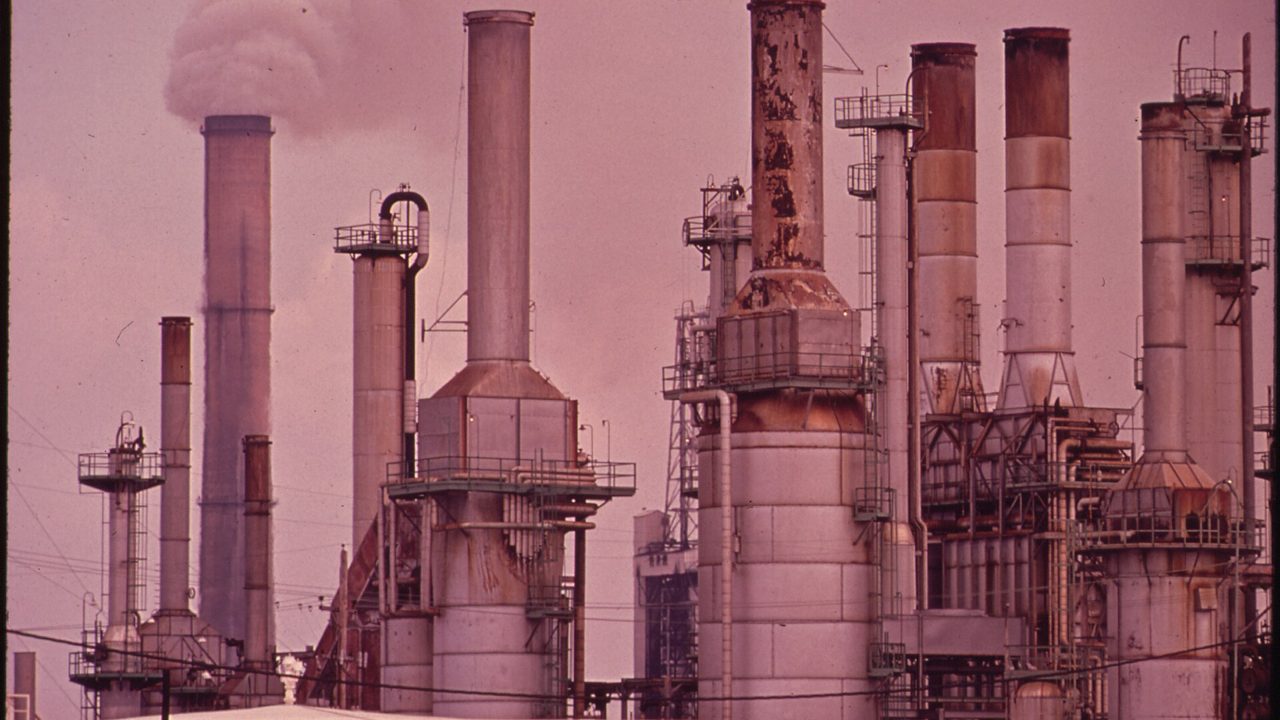
Marc St. Gil, U.S. National Archives, via Wikimedia Commons (public domain). Illustrative image.
Himadri Speciality Chemical reported consolidated total income of ₹1,733.22 crore and net profit of ₹231.32 crore for the quarter ended 30 Sep 2026. Standalone total income was ₹1,587.00 crore and net profit was ₹239.77 crore.
Key highlights
Consolidated
Including its subsidiaries
Total income: ₹1,733 crore, up 56.6% YoY, up 16.5% QoQ
Net profit: ₹231 crore, up 31.3% YoY, up 1.3% QoQ
EPS: ₹4.60, against ₹3.58 in Q2 FY26
Carbon materials and chemicals: segment revenue ₹1,539.02 crore, up 44.2% YoY
Standalone
The company on its own, without its subsidiaries
Total income: ₹1,587 crore, up 43.1% YoY, up 19.1% QoQ
Net profit: ₹240 crore, up 28.3% YoY, up 7.3% QoQ
EPS: ₹4.75, against ₹3.78 in Q2 FY26
Finance costs: ₹26.55 crore, up 101.6% YoY
Summary
Consolidated ₹ crore
Particulars
Q2 FY27
Q2 FY26
YoY
Q1 FY27
QoQ
1,733.22
1,106.96
+56.6%
1,488.19
+16.5%
Revenue from operations
1,691.43
1,071.03
+57.9%
1,431.88
+18.1%
Other income
41.79
35.93
+16.3%
56.31
-25.8%
231.32
176.14
+31.3%
228.43
+1.3%
Finance costs
27.72
14.78
+87.6%
22.41
+23.7%
Depreciation
21.69
17.39
+24.7%
21.30
+1.8%
Tax expense
76.02
60.40
+25.9%
72.08
+5.5%
Net profit margin
13.35%
15.91%
-2.57 pp
15.35%
-2.00 pp
Tax as share of profit before tax
24.7%
25.5%
-0.80 pp
24.0%
+0.75 pp
EPS, basic (₹)
4.60
3.58
+28.5%
4.55
+1.1%
Figures are in ₹ crore; YoY compares with Q2 FY26 and QoQ with Q1 FY27. Click Total income or Net profit to see the rows behind them.
Revenue grew far faster than profit, so margins compressed. Revenue from operations rose 57.9% to ₹1,691.43 crore but net profit only 31.3% to ₹231.32 crore; net margin fell to 13.35% of total income from 15.91%, and the filing's own ratios put the operating margin at 17.93% against 22.21% a year ago. Profit before tax rose to ₹307.34 crore from ₹236.54 crore (derived: net profit plus tax), so ₹620 crore of extra revenue brought about ₹71 crore of extra pre-tax profit, roughly 11 paise per rupee.
Funding costs are rising with the balance sheet. Finance costs nearly doubled, up 87.6% to ₹27.72 crore and 23.7% QoQ, against depreciation up 24.7% to ₹21.69 crore, and the debt-equity ratio is 0.22 against 0.21. Part of the funding is commercial paper: ₹150 crore at 6.60% issued on 9 Jul 2026 and redeemed on 7 Oct 2026, replaced by a fresh ₹150 crore at 6.60% issued on 9 Oct 2026 and due on 28 Dec 2026, rated ICRA A1+.
Growth came from carbon materials and chemicals, and the group has been adding subsidiaries. That segment had revenue of ₹1,539.02 crore, up 44.2% from ₹1,067.21 crore and about 90% of segment revenue, against ₹33.32 crore for power and ₹144.14 crore for others. Ardent Impex FZCO, Dubai, became a wholly owned subsidiary on 22 Jun 2026, and the cash flow shows cash acquired on acquisition of subsidiaries. The filing does not separate organic growth from acquired revenue.
Against Q1 FY27 revenue rose 18.1% but net profit only 1.3%, from ₹228.43 crore, so the margin slipped again. For H1 FY27 revenue from operations is ₹3,123.31 crore, up 42.7%, and net profit ₹459.75 crore, up 29.3%.
Standalone ₹ crore
Particulars
Q2 FY27
Q2 FY26
YoY
Q1 FY27
QoQ
1,587.00
1,108.70
+43.1%
1,332.71
+19.1%
Revenue from operations
1,542.67
1,070.41
+44.1%
1,274.26
+21.1%
Other income
44.33
38.29
+15.8%
58.45
-24.2%
239.77
186.85
+28.3%
223.42
+7.3%
Finance costs
26.55
13.17
+101.6%
21.22
+25.1%
Depreciation
19.69
15.59
+26.3%
19.25
+2.3%
Tax expense
78.10
60.29
+29.5%
70.65
+10.5%
Net profit margin
15.11%
16.85%
-1.74 pp
16.76%
-1.66 pp
Tax as share of profit before tax
24.6%
24.4%
+0.17 pp
24.0%
+0.54 pp
EPS, basic (₹)
4.75
3.78
+25.7%
4.43
+7.2%
Figures are in ₹ crore; YoY compares with Q2 FY26 and QoQ with Q1 FY27. Click Total income or Net profit to see the rows behind them.
The listed company earns more than the group. Standalone net profit is ₹239.77 crore (+28.3%) on revenue from operations of ₹1,542.67 crore (+44.1%), against ₹231.32 crore consolidated. The subsidiaries add ₹146.22 crore of total income but take ₹8.45 crore off the profit (both derived).
The borrowing sits in the parent. Standalone finance costs doubled to ₹26.55 crore from ₹13.17 crore, about 96% of the group's ₹27.72 crore (derived), so the group's higher interest bill is the parent's.
The auditors did not review everything they consolidated. Two foreign subsidiaries, one a step-down, were reviewed by other auditors: they had revenue of ₹130.80 crore in the quarter and ₹413.93 crore in the half, a net loss of ₹1.07 crore in the quarter and negative net assets of ₹152.96 crore at 30 Sep 2026. Another foreign subsidiary, whose figures management certified, was not reviewed at all. The auditors' conclusion is otherwise unmodified.
A demerger is pending. Under a scheme before the exchanges, the tyre business of DBRL would be transferred to Himadri from an appointed date of 1 Oct 2026, with new Himadri shares issued to DBRL's shareholders. The filing does not give the share entitlement ratio or the size of the tyre business.
Inference
Himadri's revenue is growing fast but profit is not keeping pace: the margin is lower on every measure the filing gives and finance costs have nearly doubled. The filing does not split the revenue growth by product, price or acquisition, so how much of it is organic is not stated.
For shareholders, the demerger would issue new shares and bring in a tyre business whose size and exchange ratio the filing does not give, and ₹150 crore of commercial paper falls due on 28 Dec 2026.
Create a free account to read the rest of this article and the analysis that follows.
By continuing you agree to our Terms and Privacy Policy, and to receive updates from Blacklitt by email. You can unsubscribe anytime.
Disclaimer:
The information available on this article is provided for education and informational purposes only. It does not constitute or provide financial, investment or trading advice and should not be construed as an endorsement of any specific stock or financial strategy in any form or manner. We do not make any representations or warranties regarding the quality, reliability, or accuracy of the information provided. This website may contain links to third-party content. We are not responsible for the content or accuracy of these external sources and do not endorse or verify the information provided by third parties. We are not liable for any decisions made or actions taken based on the information provided on this website.


 HSCLHimadri Speciality Chemical Ltd