Hindustan Zinc Q2 FY27 Results: Consolidated Net Profit ₹6,412 Crore on Total Income of ₹15,467 Crore
Earnings
Metals
Blacklitt Research4 min read
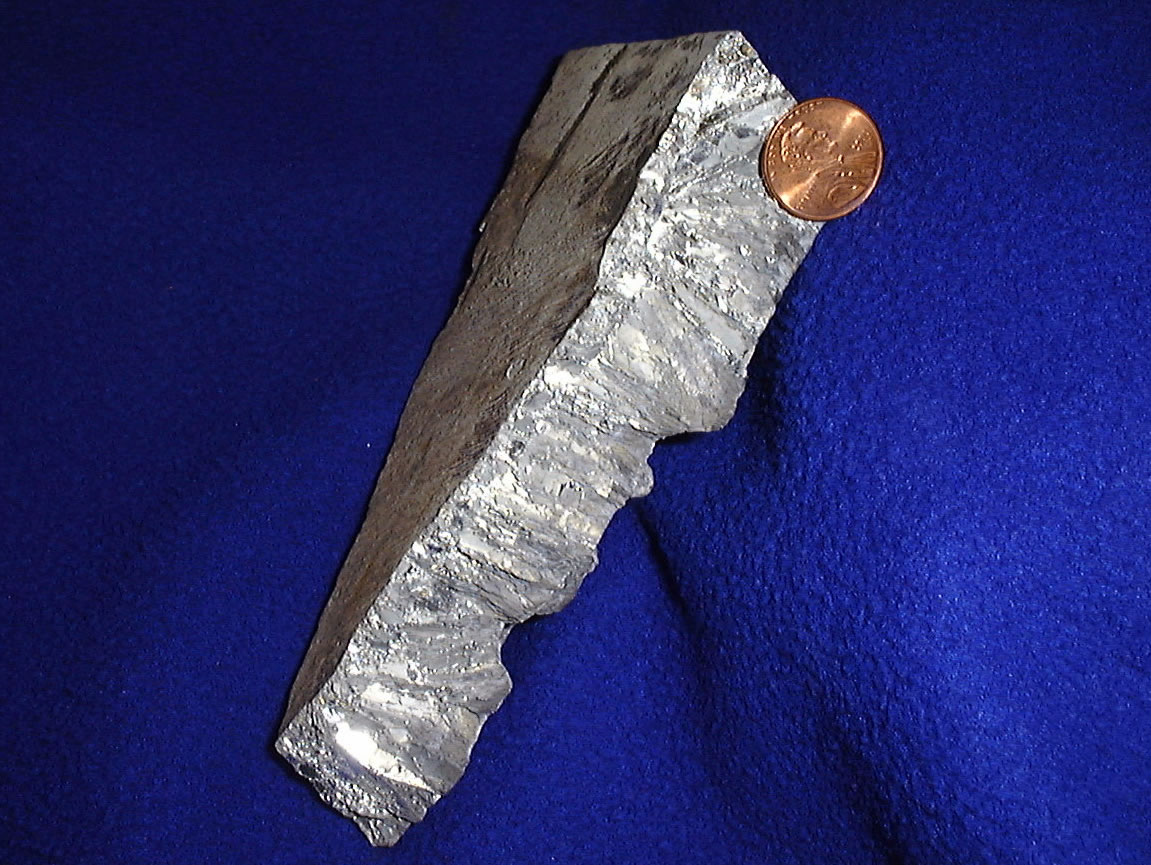
U.S. Geological Survey and Mineral Information Institute, via Wikimedia Commons (public domain, U.S. government work). Illustrative image.
Hindustan Zinc reported consolidated total income of ₹15,467 crore and net profit of ₹6,412 crore for the quarter ended 30 Sep 2026. Standalone total income was ₹15,334 crore and net profit was ₹6,317 crore.
Key highlights
Consolidated
Including its subsidiaries
Total income: ₹15,467 crore, up 76.0% YoY, up 10.0% QoQ
Net profit: ₹6,412 crore, up 142.1% YoY, up 17.2% QoQ
EPS: ₹15.18, against ₹6.27 in Q2 FY26
Silver revenue: ₹4,111 crore, up 140.8% YoY
Standalone
The company on its own, without its subsidiaries
Total income: ₹15,334 crore, up 75.0% YoY, up 9.5% QoQ
Net profit: ₹6,317 crore, up 140.0% YoY, up 16.4% QoQ
EPS: ₹14.95, against ₹6.23 in Q2 FY26
Summary
Consolidated ₹ crore
Particulars
Q2 FY27
Q2 FY26
YoY
Q1 FY27
QoQ
15,467
8,787
+76.0%
14,063
+10.0%
Revenue from operations
15,093
8,549
+76.5%
13,747
+9.8%
Other income
374
238
+57.1%
316
+18.4%
6,412
2,649
+142.1%
5,469
+17.2%
Finance costs
88
259
-66.0%
132
-33.3%
Depreciation
962
882
+9.1%
920
+4.6%
Tax expense
2,160
893
+141.9%
1,845
+17.1%
Net profit margin
41.46%
30.15%
+11.31 pp
38.89%
+2.57 pp
Tax as share of profit before tax
25.2%
25.2%
-0.01 pp
25.2%
-0.03 pp
EPS, basic (₹)
15.18
6.27
+142.1%
12.94
+17.3%
Figures are in ₹ crore; YoY compares with Q2 FY26 and QoQ with Q1 FY27. Click Total income or Net profit to see the rows behind them.
Profit grew faster than income because most of the extra income reached profit. Total income rose ₹6,680 crore YoY to ₹15,467 crore and net profit ₹3,763 crore to ₹6,412 crore, so about 56% of each additional rupee of income became profit (derived), and the net margin widened to 41.5% from 30.1%.
Silver is the driver the filing points to. Silver revenue rose 140.8% to ₹4,111 crore, against 59.5% growth to ₹10,414 crore for zinc, lead and other products, and silver is now 28.3% of the zinc, lead and silver segment's revenue against 20.7% a year ago. The filing does not separate metal prices from volumes.
The balance sheet is lighter. Finance costs fell 66.0% YoY to ₹88 crore and 33.3% QoQ from ₹132 crore, the debt-equity ratio is 0.21 against 0.78 a year ago, and interest service coverage is 82.48 times against 17.80. The current ratio is 2.73 against 1.21. Capital employed rose to ₹29,966 crore from ₹23,587 crore at 30 Jun 2026 and ₹13,697 crore a year earlier.
Against Q1 FY27 total income rose 10.0% and net profit 17.2% (from ₹5,469 crore). For H1 FY27 consolidated net profit is ₹11,881 crore, up 143.3% from ₹4,883 crore, on total income of ₹29,530 crore, up 75.4%. Tax of ₹2,160 crore is about 25% of profit before tax (₹8,572 crore), and there were no exceptional items.
Standalone ₹ crore
Particulars
Q2 FY27
Q2 FY26
YoY
Q1 FY27
QoQ
15,334
8,762
+75.0%
14,002
+9.5%
Revenue from operations
14,961
8,525
+75.5%
13,687
+9.3%
Other income
373
237
+57.4%
315
+18.4%
6,317
2,632
+140.0%
5,425
+16.4%
Finance costs
88
259
-66.0%
132
-33.3%
Depreciation
960
881
+9.0%
918
+4.6%
Tax expense
2,142
891
+140.4%
1,834
+16.8%
Net profit margin
41.20%
30.04%
+11.16 pp
38.74%
+2.45 pp
Tax as share of profit before tax
25.3%
25.3%
+0.03 pp
25.3%
+0.05 pp
EPS, basic (₹)
14.95
6.23
+140.0%
12.84
+16.4%
Figures are in ₹ crore; YoY compares with Q2 FY26 and QoQ with Q1 FY27. Click Total income or Net profit to see the rows behind them.
Hindustan Zinc is almost the whole group. Standalone total income of ₹15,334 crore and net profit of ₹6,317 crore are only ₹133 crore and ₹95 crore below the consolidated figures, and standalone growth is the same (+75.0% income, +140.0% profit); finance costs are identical at ₹88 crore.
Nearly all of the earnings come from one segment. Zinc, lead and silver brought in ₹14,525 crore of segment revenue and made ₹8,329 crore of segment profit before interest and tax, a margin of about 57% (derived). Wind energy had ₹57 crore of revenue and ₹36 crore of profit, under 0.4% of segment revenue, and all the material expenses relate to the zinc, lead and silver segment.
Cash is being returned at scale and two matters are unresolved. The board declared an interim dividend of ₹11 a share, ₹4,648 crore, on 24 Apr 2026 with a record date of 30 Apr 2026, about 39% of the half's consolidated net profit (derived). A short seller published reports in the previous financial year alleging matters against some Vedanta Group entities including Hindustan Zinc; management believes the allegations are baseless, and says that after its investigation SEBI communicated observations on certain non-compliances on related party transactions, with no financial penalty, restriction or sanction. The Enforcement Directorate searched the company's premises under the Foreign Exchange Management Act from 1 to 3 Jun 2026; the company says it cooperated fully and has received no further communication. The filing gives no date for settling either matter and does not quantify any effect. The statutory auditors gave an unmodified conclusion.
Inference
The result is a metals-price and mix story concentrated in one segment and one company, and the filing does not split it between price and volume. The filing gives no production volumes, realised prices or cost breakdown, so what drove the widening margin cannot be read from it.
For shareholders, the SEBI and Enforcement Directorate matters are open with no dates or amounts in the filing, and the size of the dividend relative to profit is the main use of cash it shows.
Create a free account to read the rest of this article and the analysis that follows.
By continuing you agree to our Terms and Privacy Policy, and to receive updates from Blacklitt by email. You can unsubscribe anytime.
Disclaimer:
The information available on this article is provided for education and informational purposes only. It does not constitute or provide financial, investment or trading advice and should not be construed as an endorsement of any specific stock or financial strategy in any form or manner. We do not make any representations or warranties regarding the quality, reliability, or accuracy of the information provided. This website may contain links to third-party content. We are not responsible for the content or accuracy of these external sources and do not endorse or verify the information provided by third parties. We are not liable for any decisions made or actions taken based on the information provided on this website.