Max Healthcare Institute Q2 FY27 Results: Consolidated Net Profit ₹414 Crore on Total Income of ₹2,610 Crore
Earnings
Hospital services
Blacklitt Research4 min read
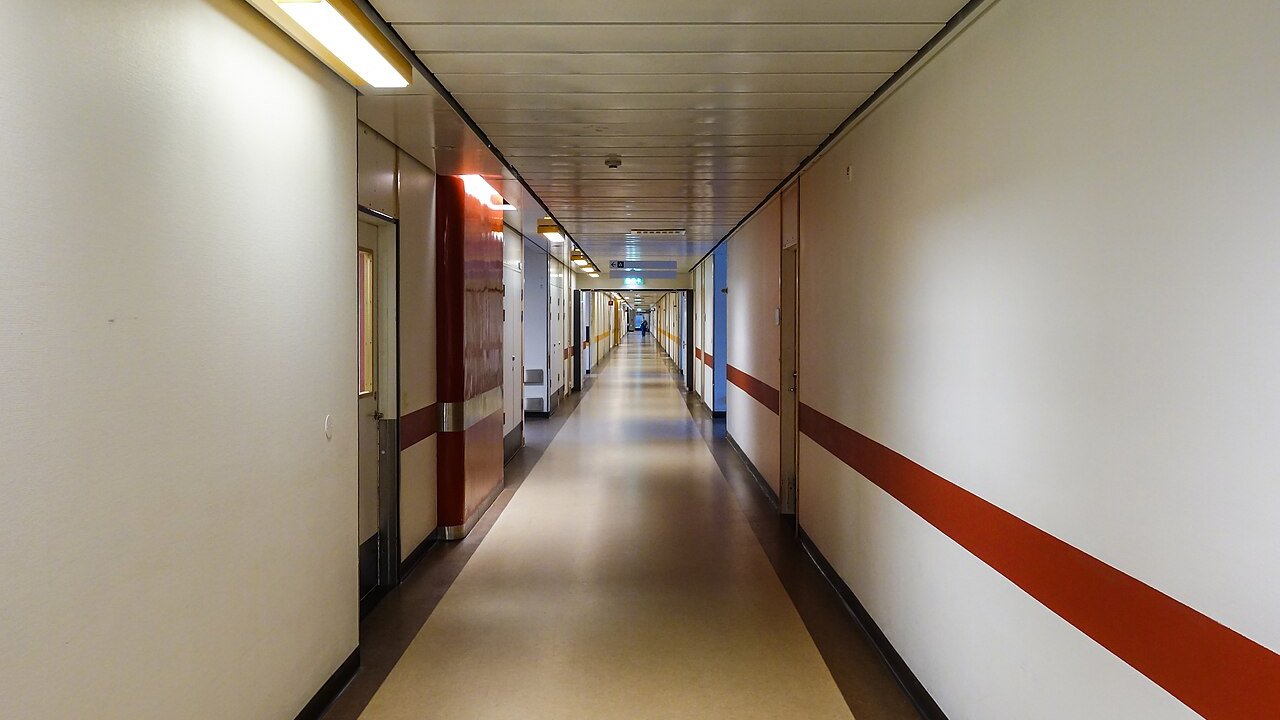
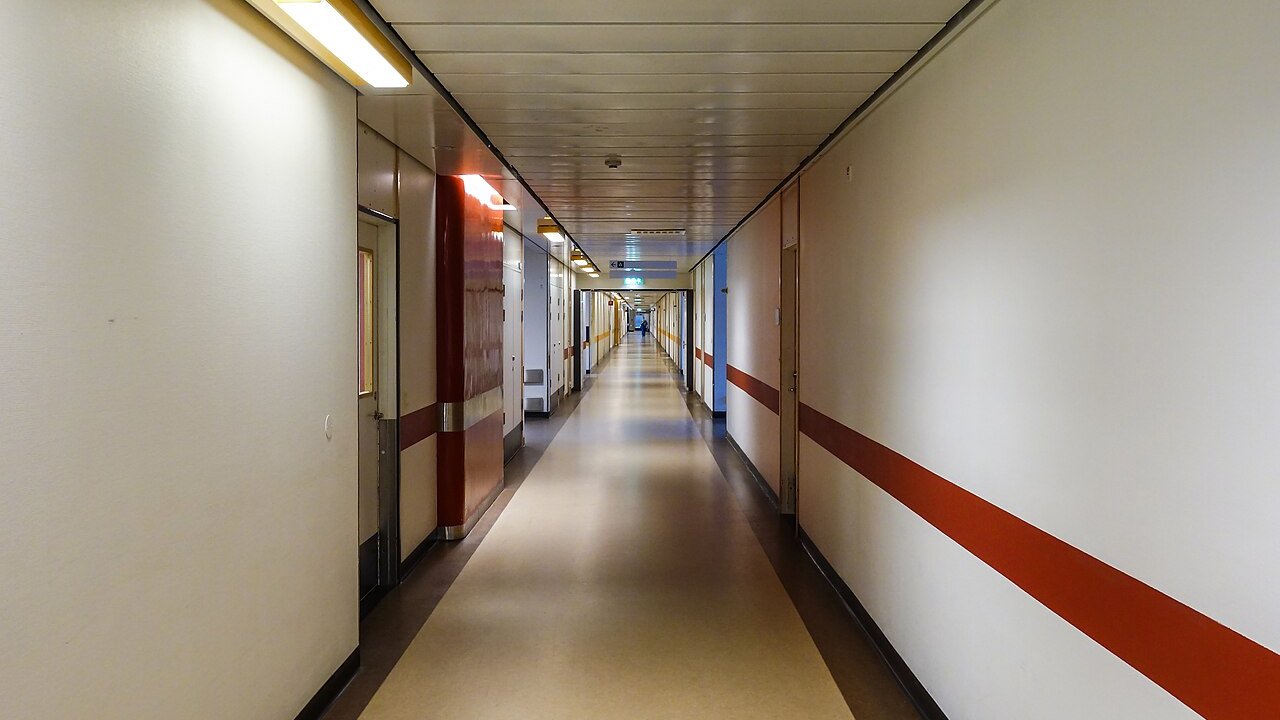
W.carter, via Wikimedia Commons (CC0). Illustrative image.
Max Healthcare Institute (NSE: MAXHEALTH) reported consolidated total income of ₹2,610 crore and net profit of ₹414 crore for the quarter ended 30 Sep 2026. On a standalone basis, total income was ₹891 crore and net profit ₹168 crore. It said in a filing on 30 Oct 2026.
Key highlights
Consolidated
Including its subsidiaries
Total income: ₹2,610 crore, up 20.4% YoY and 8.5% QoQ
Net profit and EPS: ₹414 crore, down 15.6% YoY and up 28.3% QoQ; basic EPS ₹4.26 against ₹5.05 a year earlier
Finance costs: ₹74 crore, up 36.9% YoY
Standalone
The company on its own, without its subsidiaries
Total income: ₹891 crore, up 13.7% YoY and 1.8% QoQ
Net profit and EPS: ₹168 crore, up 4.9% YoY and 0.4% QoQ; basic EPS ₹1.73 against ₹1.65 a year earlier
Other income: ₹49 crore, down 46.7% from ₹92 crore in the quarter ended 30 Jun 2026
Summary
Consolidated ₹ crore
Particulars
Q2 FY27
Q2 FY26
YoY
Q1 FY27
QoQ
2,610
2,168
+20.4%
2,407
+8.5%
Revenue from operations
2,569
2,135
+20.3%
2,366
+8.6%
Other income
41
33
+24.3%
41
+0.9%
414
491
-15.6%
323
+28.3%
Profit before tax
541
446
+21.3%
436
+24.0%
Finance costs
74
54
+36.9%
71
+4.0%
Depreciation
138
108
+27.3%
132
+4.5%
Tax expense
126
n/a
n/a
113
+11.6%
Net profit margin
15.88%
22.66%
-6.78 pp
13.42%
+2.46 pp
EPS, basic (₹)
4.26
5.05
-15.6%
3.32
+28.3%
Figures are in ₹ crore; YoY compares with Q2 FY26 and QoQ with Q1 FY27. Click Total income or Net profit to see the rows behind them.
Consolidated net profit fell 15.6% YoY to ₹414 crore while total income rose 20.4% to ₹2,610 crore. Against the quarter ended 30 Jun 2026, net profit rose 28.3% and total income rose 8.5%, so profit grew faster than income on that comparison. Profit before tax rose 21.3% YoY to ₹541 crore, and tax expense of ₹126 crore is 23.4% of profit before tax of ₹540.92 crore.
The year-earlier net profit was ₹491 crore, and the notes say the group recognised a reversal of current tax and net deferred tax credit in the quarter and half year ended 30 Sep 2025, from the merger of erstwhile Crosslay Remedies Limited.
Finance costs grew faster than income. They rose 36.9% YoY to ₹74 crore, 2.8% of total income, and depreciation rose 27.3% to ₹138 crore. Revenue from operations rose 20.3% to ₹2,569 crore, slower than other income, which rose 24.3% to ₹41 crore.
Acquisitions shape the half-year comparison. The notes say the Kalinga Hospital results are included only from 18 May 2026, so the consolidated half-year results are not comparable with the corresponding previous period. Provisional goodwill of ₹200.96 crore was recognised on that acquisition, and the Yerawada Properties Class A shares bought on 30 Jun 2026 cost ₹87.92 crore.
Standalone ₹ crore
Particulars
Q2 FY27
Q2 FY26
YoY
Q1 FY27
QoQ
891
784
+13.7%
875
+1.8%
Revenue from operations
842
737
+14.3%
783
+7.5%
Other income
49
47
+3.5%
92
-46.7%
168
160
+4.9%
168
+0.4%
Profit before tax
226
216
+4.9%
226
+0.1%
Finance costs
14
9
+58.2%
12
+13.7%
Depreciation
39
37
+5.4%
37
+5.9%
Tax expense
58
55
+4.7%
58
-0.8%
Net profit margin
18.89%
20.46%
-1.57 pp
19.15%
-0.26 pp
EPS, basic (₹)
1.73
1.65
+4.8%
1.72
+0.6%
Figures are in ₹ crore; YoY compares with Q2 FY26 and QoQ with Q1 FY27. Click Total income or Net profit to see the rows behind them.
Standalone net profit rose 4.9% YoY to ₹168 crore, slower than total income, which rose 13.7% to ₹891 crore. Profit before tax rose 4.9% to ₹226 crore. Quarter on quarter, net profit rose 0.4% and total income rose 1.8%.
Revenue from operations rose 14.3% YoY to ₹842 crore, faster than other income, which rose 3.5% to ₹49 crore. Other income fell 46.7% from ₹92 crore in the quarter ended 30 Jun 2026, and is 5.5% of total income this quarter.
Finance costs rose 58.2% YoY to ₹14 crore, and depreciation rose 5.4% to ₹39 crore. Tax expense rose 4.7% to ₹58 crore, which is 25.6% of profit before tax of ₹226.15 crore.
The board approved capital expenditure of about ₹93 crore for Max Super Speciality Hospital, Sector-128, Noida, which the filing says adds about 85 beds to about 400 existing beds within 15 months, and about ₹97 crore for two additional floors at Max Super Speciality Hospital, Vaishali, which adds about 60 beds to about 387 existing beds within 24 months. Both are to be funded from internal accruals.
The Gurugram hospital's project cost was revised to about ₹1,143 crore, and its completion date moved to April 2027. The filing states the revision is primarily attributable to changes in façade specifications, additional construction requirements, development of the atrium and enhanced interior fit-outs.
Inference
Capital and ownership: a final dividend of ₹2 per share, 20% of face value, was approved at the AGM on 30 Jul 2026 and paid on 11 Aug 2026. The Nomination and Remuneration Committee approved grant of 3,61,827 stock options at ₹350 to ₹800 a share on 13 Aug 2026, and shareholders approved a Performance Linked Restricted Stock Unit Scheme 2026 for up to 73,50,000 units on 19 Oct 2026.
Kalinga Hospital: the group acquired a 58.28% stake on 18 May 2026 for ₹297.97 crore, subscribed to its rights issue for ₹87.87 crore in the quarter, and now holds 66.34%. The board also approved the appointment of Dharmender Kumar as Director and Chief - Public Affairs, identified as senior management personnel, effective 1 Nov 2026.
The filing does not explain the rise in consolidated finance costs, and does not say how the Gurugram cost increase will be funded.
Create a free account to read the rest of this article and the analysis that follows.
By continuing you agree to our Terms and Privacy Policy, and to receive updates from Blacklitt by email. You can unsubscribe anytime.
Disclaimer:
The information available on this article is provided for education and informational purposes only. It does not constitute or provide financial, investment or trading advice and should not be construed as an endorsement of any specific stock or financial strategy in any form or manner. We do not make any representations or warranties regarding the quality, reliability, or accuracy of the information provided. This website may contain links to third-party content. We are not responsible for the content or accuracy of these external sources and do not endorse or verify the information provided by third parties. We are not liable for any decisions made or actions taken based on the information provided on this website.


 MAXHEALTHMax Healthcare Institute Ltd.