Seshasayee Paper and Boards Q2 FY27 Results: Consolidated Net Profit ₹42.31 Crore on Total Income of ₹515 Crore
Earnings
paper and boards
Blacklitt Research4 min read
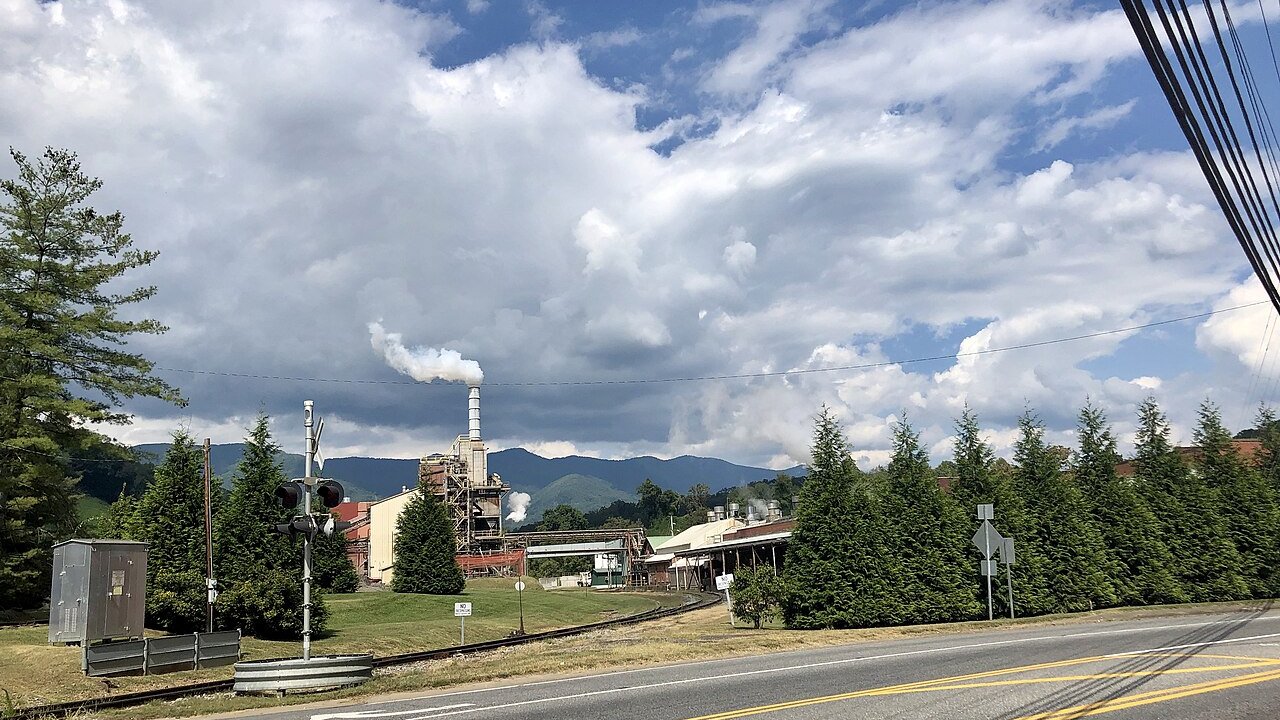
Warren LeMay from Cullowhee, NC, United States, via Wikimedia Commons (CC0). Illustrative image.
Seshasayee Paper and Boards (NSE: SESHAPAPER) reported total income of ₹514.95 crore on a consolidated basis and net profit of ₹42.31 crore for the quarter ended 30 Sep 2026, with standalone total income of ₹514.85 crore and net profit of ₹34.96 crore, it said in a filing on 24 Oct 2026.
Key highlights
Consolidated
Including its subsidiaries
Total income: ₹514.95 crore, up 43.2% YoY and 2.2% QoQ
Net profit: ₹42.31 crore, up 88.8% YoY and 32.6% QoQ
EPS: ₹7.03 basic, against ₹3.72 a year earlier and ₹5.30 in Q1 FY27
Share of associate profit: ₹7.30 crore from Ponni Sugars (Erode) Limited, nil in standalone results
Standalone
The company on its own, without its subsidiaries
Total income: ₹514.85 crore, up 43.2% YoY and 1.9% QoQ
Net profit: ₹34.96 crore, up 96.4% YoY and 4.1% QoQ
EPS: ₹5.80 basic, against ₹2.96 a year earlier and ₹5.58 in Q1 FY27
Finance costs: ₹0.34 crore, against ₹4.43 crore a year earlier
Summary
Consolidated ₹ crore
Particulars
Q2 FY27
Q2 FY26
YoY
Q1 FY27
QoQ
514.95
359.66
+43.2%
503.97
+2.2%
Revenue from operations
503.06
346.32
+45.3%
492.08
+2.2%
Other income
11.89
13.34
-10.9%
11.89
0.0%
42.31
22.41
+88.8%
31.91
+32.6%
Profit before tax
54.12
28.71
+88.5%
43.44
+24.6%
Finance costs
0.34
4.43
-92.3%
0.41
-17.1%
Depreciation
11.62
11.14
+4.3%
11.61
+0.1%
Tax expense
11.81
6.30
+87.5%
11.53
+2.4%
Net profit margin
8.22%
6.23%
+1.99 pp
6.33%
+1.88 pp
EPS, basic (₹)
7.03
3.72
+89.0%
5.30
+32.6%
Figures are in ₹ crore; YoY compares with Q2 FY26 and QoQ with Q1 FY27. Click Total income or Net profit to see the rows behind them.
Profit grew about twice as fast as income. Consolidated total income rose 43.2% YoY, but net profit rose 88.8% and profit before tax rose 88.5%. Revenue from operations, at ₹503.06 crore, rose 45.3%, while other income fell 10.9% to ₹11.89 crore.
Consolidated net profit rose 88.8% YoY, slower than the 96.4% rise in standalone net profit. The difference sits below profit before tax: the consolidated figure adds ₹7.30 crore of share of profit from the associate Ponni Sugars (Erode) Limited, which the standalone results do not carry. The filing says the company acquired 2.90 lakh further shares in that associate in the quarter, raising its effective holding from 32.40% to 35.78%, and that the share of profit is computed at the revised holding from the date of acquisition.
Finance costs fell to ₹0.34 crore from ₹4.43 crore a year earlier and are 0.1% of total income. The filing does not give the reason for the fall. Other income of ₹11.89 crore is 22.0% of profit before tax, so a sizeable part of the pre-tax profit is the associate share and other income rather than paper operations alone; the filing says paper is the only reportable segment.
Standalone ₹ crore
Particulars
Q2 FY27
Q2 FY26
YoY
Q1 FY27
QoQ
514.85
359.58
+43.2%
505.25
+1.9%
Revenue from operations
502.99
346.25
+45.3%
492.00
+2.2%
Other income
11.86
13.33
-11.0%
13.25
-10.5%
34.96
17.80
+96.4%
33.59
+4.1%
Profit before tax
46.76
24.08
+94.2%
45.10
+3.7%
Finance costs
0.34
4.43
-92.3%
0.41
-17.1%
Depreciation
11.62
11.13
+4.4%
11.60
+0.2%
Tax expense
11.80
6.28
+87.9%
11.51
+2.5%
Net profit margin
6.79%
4.95%
+1.84 pp
6.65%
+0.14 pp
EPS, basic (₹)
5.80
2.96
+95.9%
5.58
+3.9%
Figures are in ₹ crore; YoY compares with Q2 FY26 and QoQ with Q1 FY27. Click Total income or Net profit to see the rows behind them.
Standalone net profit rose 96.4% YoY to ₹34.96 crore, faster than the 43.2% rise in total income and the 94.2% rise in profit before tax. Tax expense of ₹11.80 crore is 25.2% of profit before tax, against ₹6.28 crore a year earlier, so tax grew at about the same pace as profit.
Other income of ₹11.86 crore is 25.4% of standalone profit before tax. Exceptional items are nil in all periods shown, so no one-off item sits in these figures. The year-earlier quarter carries a finance cost of ₹4.43 crore against ₹0.34 crore now, a low base for the profit comparison that the filing does not explain.
The filing describes the Servalakshmi Paper Limited assets, bought at an NCLT-approved e-auction as a going concern. The NCLT Chennai bench approved the sale on 12 May 2023; the sales certificate has been issued and the assets handed over. Of three appeals to NCLAT, two were dismissed as withdrawn and one has been heard and reserved for orders. The company says it continues to take steps for revival, refurbishment and recommencement of operations.
Limited review reports from Suri and Co carry unmodified conclusions on both the standalone and consolidated results. The results were approved by the Board on 24 Oct 2026, after the Audit Committee and Board reviewed them on 23 Oct 2026 and 24 Oct 2026.
Inference
The results show a higher profit on a standalone and consolidated basis, with the year-earlier quarter carrying finance costs of ₹4.43 crore against ₹0.34 crore now. Paid-up equity capital is ₹12.04 crore at ₹2 face value, and the dividend paid in the six months was ₹12.61 crore on both bases.
The filing does not give the price paid for the 2.90 lakh additional PSEL shares, the reason for the fall in finance costs or the rise in revenue from operations, or the expected timing and cost of reviving the Servalakshmi assets. The outcome of the pending NCLAT appeal is also not stated.
Create a free account to read the rest of this article and the analysis that follows.
By continuing you agree to our Terms and Privacy Policy, and to receive updates from Blacklitt by email. You can unsubscribe anytime.
Disclaimer:
The information available on this article is provided for education and informational purposes only. It does not constitute or provide financial, investment or trading advice and should not be construed as an endorsement of any specific stock or financial strategy in any form or manner. We do not make any representations or warranties regarding the quality, reliability, or accuracy of the information provided. This website may contain links to third-party content. We are not responsible for the content or accuracy of these external sources and do not endorse or verify the information provided by third parties. We are not liable for any decisions made or actions taken based on the information provided on this website.


 SESHAPAPERSeshasayee Paper and Boards Ltd.