Tejas Networks Q2 FY27 Results: Consolidated Net Loss ₹207 Crore on Total Income of ₹413 Crore
Earnings
Telecom
Blacklitt Research3 min read
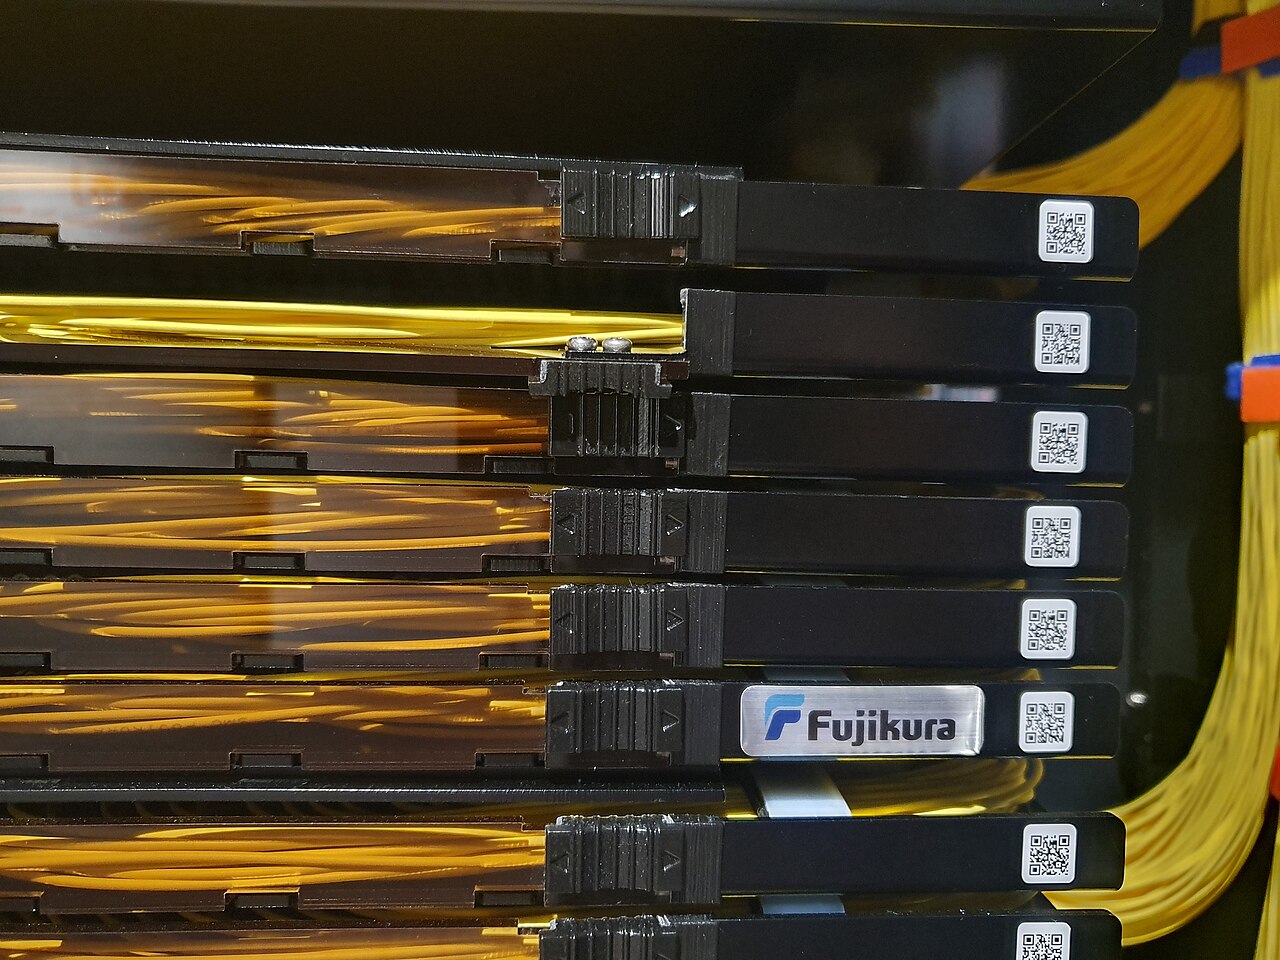
Illustrative image. Photo: Syced, via Wikimedia Commons (CC0)
Tejas Networks reported consolidated total income of ₹413.45 crore and net loss of ₹206.94 crore for the quarter ended 30 Sep 2026. Standalone total income was ₹412.72 crore and net loss was ₹207.77 crore.
Key highlights
Consolidated
Including its subsidiaries
Total income: ₹413 crore, up 54.4% YoY, up 0.6% QoQ
Net loss: ₹207 crore, against a loss of ₹307 crore in Q2 FY26, against a loss of ₹202 crore in Q1 FY27
EPS: a loss of ₹11.62
Revenue from operations: ₹405.68 crore, up 54.9% YoY
Standalone
The company on its own, without its subsidiaries
Total income: ₹413 crore, up 54.4% YoY, up 0.4% QoQ
Net loss: ₹208 crore, against a loss of ₹307 crore in Q2 FY26, against a loss of ₹202 crore in Q1 FY27
EPS: a loss of ₹11.67
Cost of materials: ₹237.84 crore, against ₹246.22 crore, which included a ₹145.43 crore charge
Summary
Consolidated ₹ crore
Particulars
Q2 FY27
Q2 FY26
YoY
Q1 FY27
QoQ
413.45
267.83
+54.4%
411.13
+0.6%
Revenue from operations
405.68
261.82
+54.9%
402.16
+0.9%
Other income
7.77
6.01
+29.3%
8.97
-13.4%
-206.94
-307.13
+32.6%
-202.24
-2.3%
Finance costs
86.53
84.32
+2.6%
85.07
+1.7%
Depreciation
91.48
100.98
-9.4%
94.35
-3.0%
Tax expense
-69.94
-165.86
+57.8%
-68.57
-2.0%
Net profit margin
-50.05%
-114.67%
+64.62 pp
-49.19%
-0.86 pp
EPS, basic (₹)
-11.62
n/a
n/a
n/a
n/a
Figures are in ₹ crore; YoY compares with Q2 FY26 and QoQ with Q1 FY27. Click Total income or Net profit to see the rows behind them.
The loss narrowed because revenue grew and a year-ago charge did not recur, not because the business got cheaper to run. Revenue from operations rose 54.9% to ₹405.68 crore and the net loss shrank to ₹206.94 crore from ₹307.13 crore. The pre-tax loss (derived: the net loss less the tax credit) fell to about ₹276.88 crore from ₹472.99 crore, a ₹196 crore improvement, of which ₹145.43 crore is the charge for contract manufacturing process losses, design changes and other matters that sat in Q2 FY26's cost of materials. Roughly ₹51 crore is underlying.
Fixed costs still take a large share of revenue. Depreciation of ₹91.48 crore (down 9.4%) and finance costs of ₹86.53 crore (up 2.6%) together come to about 44% of revenue from operations (derived), and neither moves with sales. Against Q1 FY27 revenue was nearly flat (up 0.9%) and the net loss widened 2.3% from ₹202.24 crore, so the progress is year on year, not quarter on quarter.
The tax line is a credit. Tax expense is negative ₹69.94 crore, against negative ₹165.86 crore a year earlier, so the loss after tax is smaller than the loss before it. For H1 FY27 standalone revenue from operations is ₹806.86 crore against ₹463.30 crore, and the net loss ₹410.01 crore against ₹501.08 crore.
Standalone ₹ crore
Particulars
Q2 FY27
Q2 FY26
YoY
Q1 FY27
QoQ
412.72
267.38
+54.4%
410.92
+0.4%
Revenue from operations
404.91
261.37
+54.9%
401.95
+0.7%
Other income
7.81
6.01
+30.0%
8.97
-12.9%
-207.77
-307.17
+32.4%
-202.24
-2.7%
Finance costs
86.50
84.26
+2.7%
85.04
+1.7%
Depreciation
91.48
100.98
-9.4%
94.35
-3.0%
Tax expense
-69.94
-165.86
+57.8%
-68.57
-2.0%
Net profit margin
-50.34%
-114.88%
+64.54 pp
-49.22%
-1.13 pp
EPS, basic (₹)
-11.67
n/a
n/a
n/a
n/a
Figures are in ₹ crore; YoY compares with Q2 FY26 and QoQ with Q1 FY27. Click Total income or Net profit to see the rows behind them.
Standalone and consolidated are almost the same. Standalone net loss is ₹207.77 crore against ₹206.94 crore consolidated, and revenue ₹404.91 crore against ₹405.68 crore, so the subsidiaries are immaterial to the result. The loss per share is ₹11.67, against ₹17.38 a year earlier.
Take away the one-off and materials cost rose sharply as a share of revenue. Cost of materials was ₹237.84 crore, against ₹246.22 crore a year earlier; without that year's ₹145.43 crore charge it would have been about ₹100.79 crore, so materials were about 59% of revenue now against about 39% then (derived). The filing does not say what drove the change. The warranty provision fell to ₹7.24 crore from ₹44.44 crore.
Inference
Tejas Networks remains loss-making on every line the filing shows, and most of the year-on-year improvement is a charge that did not repeat. With revenue flat on the quarter and depreciation and interest absorbing about 44% of it, the filing gives no path from this to a profit.
The year-ago charge and the lower warranty provision make the comparison with Q2 FY26 flattering, and the filing does not explain why materials cost a larger share of revenue.
Create a free account to read the rest of this article and the analysis that follows.
By continuing you agree to our Terms and Privacy Policy, and to receive updates from Blacklitt by email. You can unsubscribe anytime.
Disclaimer:
The information available on this article is provided for education and informational purposes only. It does not constitute or provide financial, investment or trading advice and should not be construed as an endorsement of any specific stock or financial strategy in any form or manner. We do not make any representations or warranties regarding the quality, reliability, or accuracy of the information provided. This website may contain links to third-party content. We are not responsible for the content or accuracy of these external sources and do not endorse or verify the information provided by third parties. We are not liable for any decisions made or actions taken based on the information provided on this website.