UltraTech Cement Q2 FY27 Results: Consolidated Net Profit ₹1,501 Crore on Total Income of ₹23,406 Crore
Earnings
Cement And Cement Products
Blacklitt Research4 min read
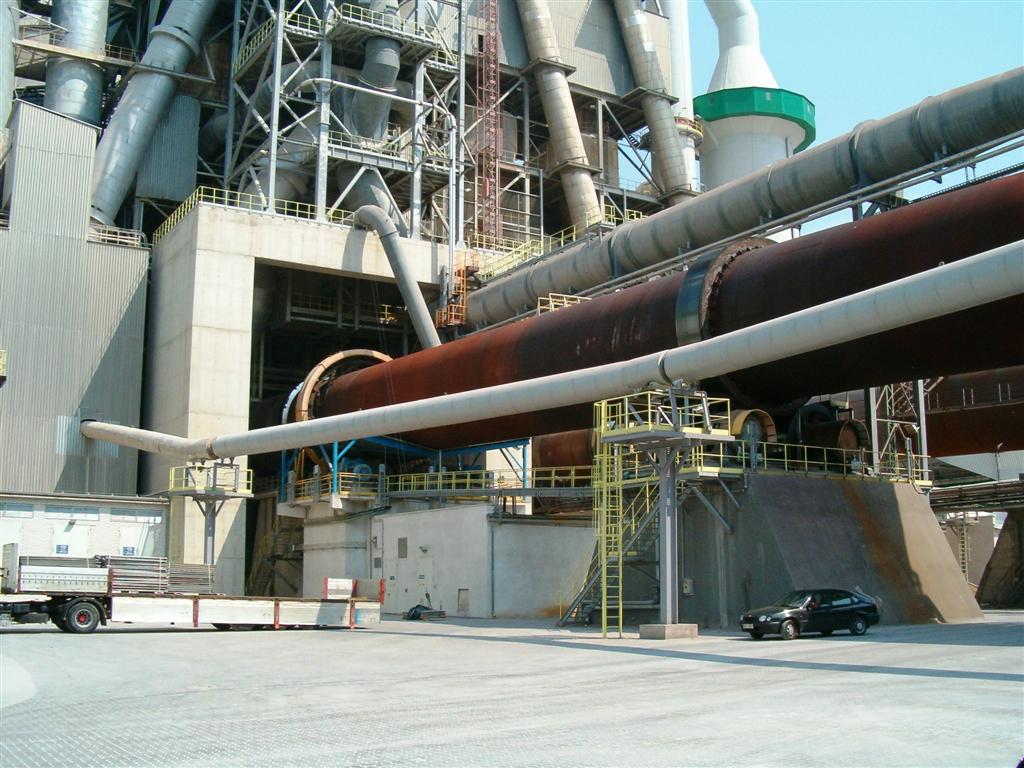
Jb957, via Wikimedia Commons (CC0 1.0). Illustrative image.
UltraTech Cement reported consolidated total income of ₹23,405.96 crore and net profit of ₹1,501.38 crore for the quarter ended 30 Sep 2026. Standalone total income was ₹22,192.25 crore and net profit was ₹1,331.78 crore.
Key highlights
Consolidated
Including its subsidiaries
Total income: ₹23,406 crore, up 18.3% YoY, down 5.5% QoQ
Net profit: ₹1,501 crore, up 21.3% YoY, down 42.3% QoQ
EPS: ₹50.78, against ₹41.87 in Q2 FY26
Volume: domestic grey cement sales 35.94 million tonnes, up 13.8% YoY; capacity utilisation 71% against 66%
Standalone
The company on its own, without its subsidiaries
Total income: ₹22,192 crore, up 23.7% YoY, down 6.2% QoQ
Net profit: ₹1,332 crore, up 25.2% YoY, down 44.4% QoQ
EPS: ₹45.28, against ₹36.17 in Q2 FY26
Summary
Consolidated ₹ crore
Particulars
Q2 FY27
Q2 FY26
YoY
Q1 FY27
QoQ
23,405.96
19,781.07
+18.3%
24,778.47
-5.5%
Revenue from operations
23,295.07
19,606.93
+18.8%
24,648.20
-5.5%
Other income
110.89
174.14
-36.3%
130.27
-14.9%
1,501.38
1,237.98
+21.3%
2,603.72
-42.3%
Finance costs
551.75
459.29
+20.1%
452.93
+21.8%
Depreciation
1,213.35
1,147.68
+5.7%
1,200.51
+1.1%
Tax expense
557.20
417.85
+33.3%
876.71
-36.4%
Net profit margin
6.41%
6.26%
+0.16 pp
10.51%
-4.09 pp
Tax as share of profit before tax
27.0%
25.1%
+1.89 pp
25.2%
+1.84 pp
EPS, basic (₹)
50.78
41.87
+21.3%
88.36
-42.5%
Figures are in ₹ crore; YoY compares with Q2 FY26 and QoQ with Q1 FY27. Click Total income or Net profit to see the rows behind them.
Growth is operating, not financial or tax-driven. Profit before tax rose faster than income, 24.0% against 18.3%, and net profit grew a little less, 21.3%, because tax took 27.0% of profit before tax against 25.1%. Net margin edged up to 6.41% from 6.26%.
Volume did most of the work. Domestic grey cement sales rose 13.8% to 35.94 million tonnes on utilisation of 71% against 66%. Total income grew faster than volume, which points to higher realisations or mix, though income also includes other products and overseas sales, so it is not a pure price effect.
Costs below the operating line are rising with the capacity programme. Finance costs rose 20.1% YoY to ₹551.75 crore and 21.8% QoQ, against depreciation up 5.7%. In the quarter the company commissioned 3.6 mtpa of greenfield capacity at Petnikota, Andhra Pradesh, and added 1.0 mtpa by debottlenecking, taking domestic grey capacity to 204.7 mtpa (210.1 mtpa with 5.4 mtpa overseas); it says it is on track for 240+ mtpa by March 2028.
The QoQ fall is the usual seasonal one. Net profit fell 42.3% from Q1, close to the 44.3% fall between Q1 and Q2 of FY26, and the company attributes the quarter to the monsoon and the ongoing west Asia crisis. H1 FY27 net profit is ₹4,105 crore, up 18.7%.
Standalone ₹ crore
Particulars
Q2 FY27
Q2 FY26
YoY
Q1 FY27
QoQ
22,192.25
17,937.07
+23.7%
23,656.65
-6.2%
Revenue from operations
22,107.68
17,864.43
+23.8%
23,535.49
-6.1%
Other income
84.57
72.64
+16.4%
121.16
-30.2%
1,331.78
1,063.85
+25.2%
2,397.12
-44.4%
Finance costs
494.43
396.20
+24.8%
396.28
+24.8%
Depreciation
1,067.84
1,001.78
+6.6%
1,051.48
+1.6%
Tax expense
494.67
381.02
+29.8%
855.50
-42.2%
Net profit margin
6.00%
5.93%
+0.07 pp
10.13%
-4.13 pp
Tax as share of profit before tax
27.1%
26.4%
+0.71 pp
26.3%
+0.78 pp
EPS, basic (₹)
45.28
36.17
+25.2%
81.48
-44.4%
Figures are in ₹ crore; YoY compares with Q2 FY26 and QoQ with Q1 FY27. Click Total income or Net profit to see the rows behind them.
Subsidiaries now add less income but about the same profit. The gap between consolidated and standalone income narrowed to ₹1,214 crore from ₹1,844 crore a year earlier, while the profit gap held at ₹170 crore against ₹174 crore. The gap also reflects intra-group eliminations, so it is not a measure of the subsidiaries alone. Standalone grew faster than the group, 25.2% against 21.3% on profit. Of the consolidated net profit, ₹1,493.77 crore belongs to the owners of the parent company and ₹7.61 crore to minority holders.
Other developments: the company launched Ultravolt, a wires and cables business, with a plant at Jhagadia, Gujarat whose planned capacity would use 78,000 tonnes of copper and 24,000 tonnes of aluminium a year; no revenue or profit for it is disclosed. It added 117 MW of renewable and 10 MW of waste heat recovery power, taking installed capacity to 1,580 MW and 444 MW, and green power was 48% of its mix.
The competition-law exposure is large against earnings. The notes describe orders imposing penalties of ₹1,804.31 crore (31 Aug 2016) and ₹68.30 crore (19 Jan 2017), under appeal. The Supreme Court has stayed the order on the larger penalty, the company has deposited ₹180.43 crore (10%) and made no provision, and the larger penalty alone is 1.2 times the quarter's consolidated net profit. The statutory auditors gave an unmodified conclusion.
Inference
Consolidated and standalone results differ because the consolidated figures include the subsidiaries; ₹7.61 crore of the consolidated profit belongs to minority holders rather than to UltraTech's own shareholders.
The filing leaves open the outcome and timing of the Supreme Court appeal, which is not reflected in these results because no provision has been made, and the contribution of the new wires and cables business, which it does not disclose.
Create a free account to read the rest of this article and the analysis that follows.
By continuing you agree to our Terms and Privacy Policy, and to receive updates from Blacklitt by email. You can unsubscribe anytime.
Disclaimer:
The information available on this article is provided for education and informational purposes only. It does not constitute or provide financial, investment or trading advice and should not be construed as an endorsement of any specific stock or financial strategy in any form or manner. We do not make any representations or warranties regarding the quality, reliability, or accuracy of the information provided. This website may contain links to third-party content. We are not responsible for the content or accuracy of these external sources and do not endorse or verify the information provided by third parties. We are not liable for any decisions made or actions taken based on the information provided on this website.


 ULTRACEMCOUltraTech Cement Ltd