 SPICSouthern Petrochemical Industries Corporation Ltd.
Southern Petrochemical Industries Corporation Q2 FY27 Results: Consolidated Net Profit ₹47.06 Crore on Total Income of ₹1,003 Crore
- Earnings
- fertilizer manufacturing

Reviewed byRachit TripathiBlacklitt Research
In a filing on 09 Nov 2026, Southern Petrochemical Industries Corporation (NSE: SPIC) reported total income of ₹1,002.74 crore for the quarter ended 30 Sep 2026. Profit after tax was ₹47.06 crore on a consolidated basis and ₹34.96 crore standalone.
Key highlights
Consolidated
Including its subsidiaries
- Total income: ₹1,002.74 crore, up 19.0% YoY and 17.9% QoQ
- Profit after tax and EPS: ₹47.06 crore, down 23.1% YoY; basic EPS ₹2.31 against ₹3.01 a year earlier
- Profit before tax: ₹61.93 crore, including ₹16.30 crore from joint venture and associates
- Dividend: ₹2.00 per equity share (20%), approved at the AGM held on 28 Sep 2026
Standalone
The company on its own, without its subsidiaries
- Total income: ₹1,002.74 crore, up 19.0% YoY and 17.9% QoQ
- Profit after tax and EPS: ₹34.96 crore, down 34.2% YoY; basic EPS ₹1.72 against ₹2.61 a year earlier
- Finance costs: ₹9.51 crore, up 36.8% from ₹6.95 crore a year earlier
Summary
| Particulars | Q2 FY27 | Q2 FY26 | YoY | Q1 FY27 | QoQ |
|---|---|---|---|---|---|
| 1,002.74 | 842.82 | +19.0% | 850.29 | +17.9% | |
| Revenue from operations | 999.17 | 817.29 | +22.3% | 848.81 | +17.7% |
| Other income | 3.57 | 25.53 | -86.0% | 1.48 | +141.2% |
| 47.06 | 61.22 | -23.1% | 60.18 | -21.8% | |
| Finance costs | 9.51 | 6.95 | +36.8% | 7.86 | +21.0% |
| Depreciation | 9.95 | 14.23 | -30.1% | 9.69 | +2.7% |
| Tax expense | 14.87 | 31.00 | -52.0% | 2.44 | +509.4% |
| Net profit margin | 4.69% | 7.26% | -2.57 pp | 7.08% | -2.38 pp |
| Tax as share of profit before tax | 24.0% | 33.6% | -9.60 pp | 3.9% | +20.11 pp |
| EPS, basic (₹) | 2.31 | 3.01 | -23.3% | 2.96 | -22.0% |
Figures are in ₹ crore; YoY compares with Q2 FY26 and QoQ with Q1 FY27. Click Total income or Net profit to see the rows behind them.
Total income rose 19.0% year on year to ₹1,002.74 crore, while profit after tax fell 23.1% to ₹47.06 crore from ₹61.22 crore. Profit before tax was ₹61.93 crore, down 32.8% from ₹92.22 crore a year earlier, and tax expense was ₹14.87 crore, 24.0% of profit before tax, against ₹31.00 crore a year earlier. Basic EPS was ₹2.31, against ₹3.01 a year earlier.
Revenue from operations was ₹999.17 crore, against ₹817.29 crore, and other income was ₹3.57 crore, against ₹25.53 crore. The share of profit of joint venture and associates was ₹16.30 crore, 26.3% of consolidated profit before tax, against ₹11.00 crore in the year-earlier quarter.
Finance costs rose 36.8% to ₹9.51 crore from ₹6.95 crore, while depreciation fell 30.1% to ₹9.95 crore from ₹14.23 crore. The consolidated results include two joint ventures and two associates, and the company has no subsidiaries.
The filing says that, because the company's share of losses in National Aromatics and Petrochemicals Corporation Limited, a joint venture, exceeded the cost of investment in an earlier year, the loss for the period has not been considered in the consolidated results.
| Particulars | Q2 FY27 | Q2 FY26 | YoY | Q1 FY27 | QoQ |
|---|---|---|---|---|---|
| 1,002.74 | 842.82 | +19.0% | 850.29 | +17.9% | |
| Revenue from operations | 999.17 | 817.29 | +22.3% | 848.81 | +17.7% |
| Other income | 3.57 | 25.53 | -86.0% | 1.48 | +141.2% |
| 34.96 | 53.10 | -34.2% | 44.88 | -22.1% | |
| Finance costs | 9.51 | 6.95 | +36.8% | 7.86 | +21.0% |
| Depreciation | 9.95 | 14.23 | -30.1% | 9.69 | +2.7% |
| Tax expense | 10.67 | 28.12 | -62.1% | -2.16 | n/a |
| Net profit margin | 3.49% | 6.30% | -2.81 pp | 5.28% | -1.79 pp |
| Tax as share of profit before tax | 23.4% | 34.6% | -11.24 pp | n/a | n/a |
| EPS, basic (₹) | 1.72 | 2.61 | -34.1% | 2.20 | -21.8% |
Figures are in ₹ crore; YoY compares with Q2 FY26 and QoQ with Q1 FY27. Click Total income or Net profit to see the rows behind them.
Total income rose 19.0% to ₹1,002.74 crore, and profit after tax fell 34.2% to ₹34.96 crore from ₹53.10 crore. Profit before tax was ₹45.63 crore against ₹81.22 crore a year earlier, and tax expense was ₹10.67 crore, 23.4% of profit before tax. Basic EPS, not annualised, was ₹1.72 against ₹2.61 a year earlier.
Other income was ₹3.57 crore, down from ₹25.53 crore a year earlier, and revenue from operations was ₹999.17 crore against ₹817.29 crore. No reason is given for the change in other income.
The standalone results account for a subsidy of ₹854.35 crore for the quarter and ₹1,569.18 crore for the six months, based on a provisional Retention Price, and a tax credit of ₹12.92 crore from re-measuring the opening deferred tax liabilities after the company chose the lower tax rate under section 200 of the Income Tax Act 2025. The final retention price has not been announced by the Department of Fertilizers, and adjustments, if any, will be assessed when it is notified.
Inference
The shareholders approved a dividend of ₹2.00 per equity share (20%) at the annual general meeting held on 28 Sep 2026. Dr. D Karthikeyan, IAS, a nominee of Tamilnadu Industrial Development Corporation Limited (TIDCO), was appointed an Additional Director, non-executive nominee director, effective 4 Nov 2026, subject to shareholder approval.
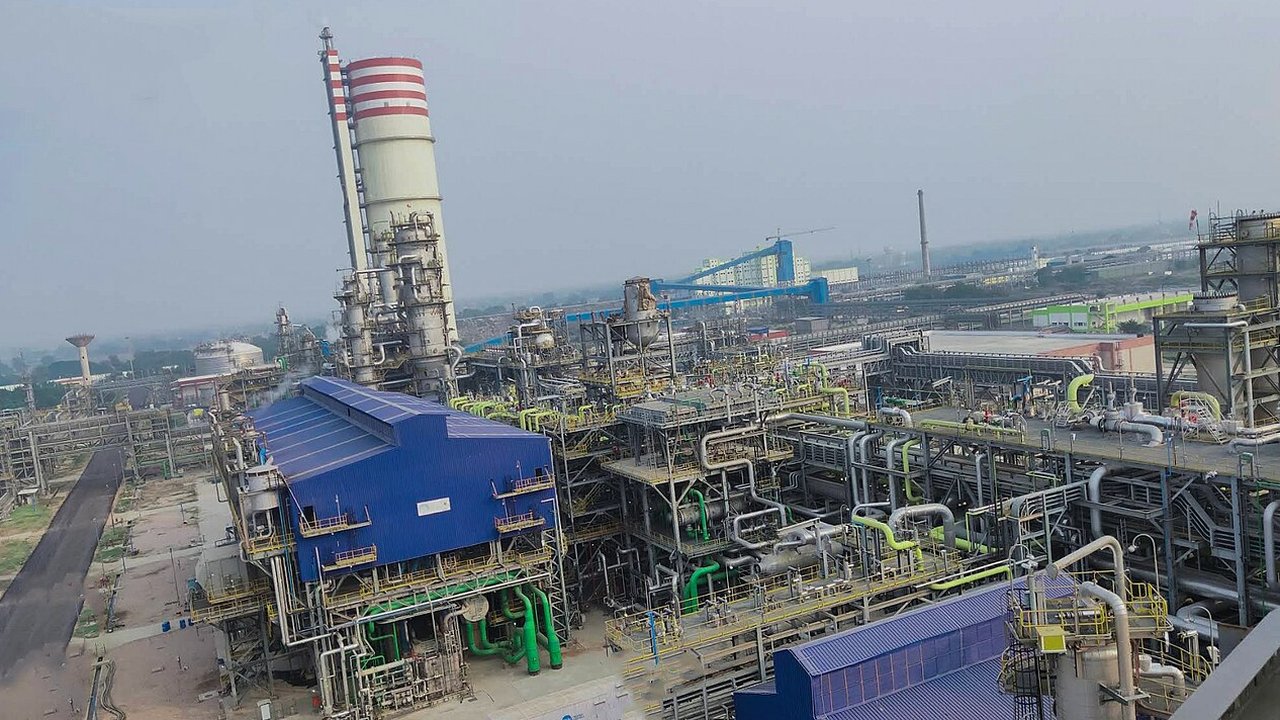
Insurance claims under process include ₹19.60 crore of the flood damage claim, and ₹4.25 crore for repair cost and ₹21.95 crore for shutdown and start up costs at the Tuticorin plant. The timing of their settlement is not stated.
Filed with BSE on . Reference: Original filing (PDF)
Disclaimer:
The information available on this article is provided for education and informational purposes only. It does not constitute or provide financial, investment or trading advice and should not be construed as an endorsement of any specific stock or financial strategy in any form or manner. We do not make any representations or warranties regarding the quality, reliability, or accuracy of the information provided. This website may contain links to third-party content. We are not responsible for the content or accuracy of these external sources and do not endorse or verify the information provided by third parties. We are not liable for any decisions made or actions taken based on the information provided on this website.