United Breweries Q2 FY27 Results: Consolidated Net Profit ₹135 Crore on Total Income of ₹4,664 Crore
Earnings
beer brewing
Blacklitt Research4 min read
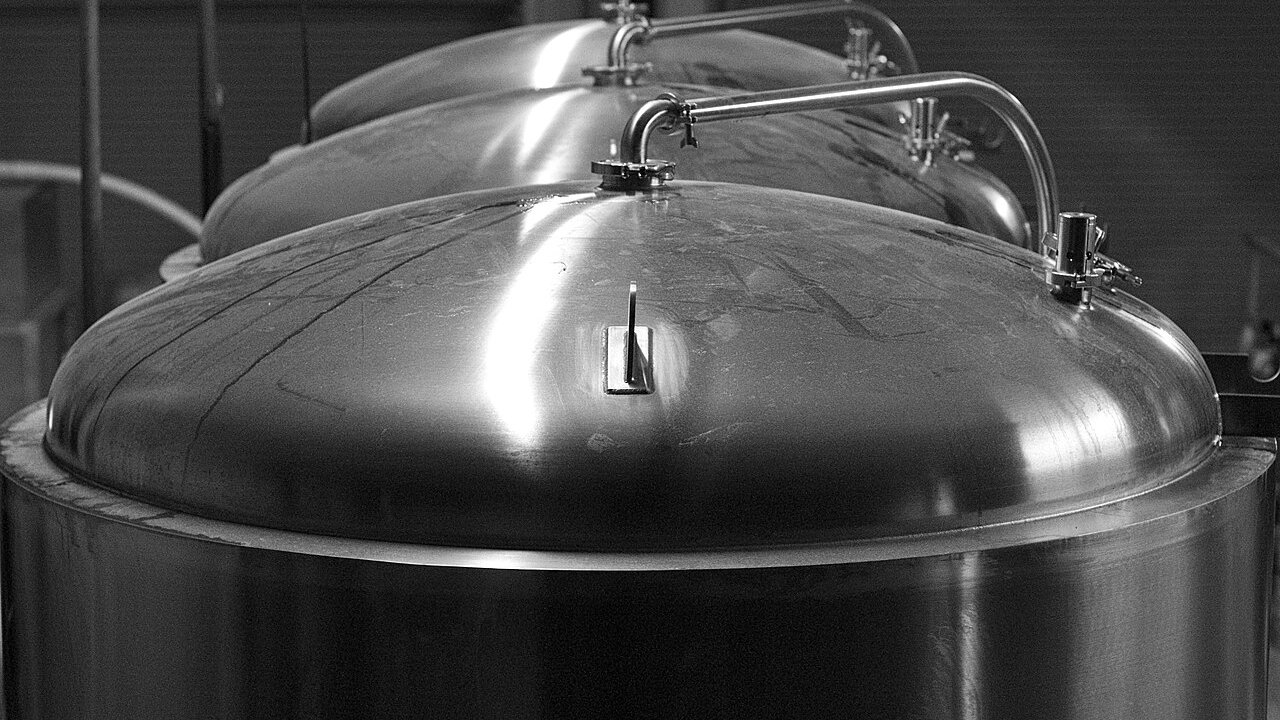
cogdogblog, via Wikimedia Commons (CC0). Illustrative image.
United Breweries (NSE: UBL) said in a filing on 27 Oct 2026 that consolidated total income for the quarter ended 30 Sep 2026 was ₹4,664.33 crore and consolidated net profit was ₹134.81 crore. Standalone total income was ₹4,662.81 crore and standalone net profit ₹135.93 crore.
Key highlights
Consolidated
Including its subsidiaries
Total income: ₹4,664.33 crore, up 24.3% YoY and down 21.9% QoQ
Net profit: ₹134.81 crore, up 190.9% YoY and down 18.9% QoQ
EPS: ₹5.12 basic, against ₹1.76 a year earlier
Dividend: ₹264.41 crore for the year ended 31 Mar 2026 (₹10 a share), paid during the quarter
Standalone
The company on its own, without its subsidiaries
Total income: ₹4,662.81 crore, up 24.3% YoY and down 21.9% QoQ
Net profit: ₹135.93 crore, up 189.5% YoY and down 18.3% QoQ
EPS: ₹5.14 basic, against ₹1.78 a year earlier
Finance costs: ₹28.31 crore, up 93.2% YoY
Summary
Consolidated ₹ crore
Particulars
Q2 FY27
Q2 FY26
YoY
Q1 FY27
QoQ
4,664.33
3,752.17
+24.3%
5,970.15
-21.9%
Revenue from operations
4,623.01
3,737.31
+23.7%
5,919.44
-21.9%
Other income
41.32
14.86
+178.1%
50.71
-18.5%
134.81
46.34
+190.9%
166.28
-18.9%
Finance costs
28.31
14.65
+93.2%
23.04
+22.9%
Depreciation
89.25
64.09
+39.3%
85.78
+4.0%
Tax expense
47.86
19.46
+145.9%
58.21
-17.8%
Net profit margin
2.89%
1.24%
+1.66 pp
2.79%
+0.11 pp
Tax as share of profit before tax
26.2%
29.6%
-3.37 pp
25.9%
+0.27 pp
EPS, basic (₹)
5.12
1.76
+190.9%
6.29
-18.6%
Figures are in ₹ crore; YoY compares with Q2 FY26 and QoQ with Q1 FY27. Click Total income or Net profit to see the rows behind them.
Net profit rose faster than total income. Consolidated net profit was ₹134.81 crore against ₹46.34 crore a year earlier, up 190.9%, while total income rose 24.3% to ₹4,664.33 crore. Profit before tax was ₹182.67 crore against ₹65.80 crore, and tax expense was ₹47.86 crore against ₹19.46 crore, so the tax share of profit before tax fell from 29.6% to 26.2%.
Other income was ₹41.32 crore against ₹14.86 crore, up 178.1%. The notes say ₹36.89 crore of the quarter's other income is interest on income tax refunds. Other income is 0.9% of total income this quarter.
Revenue from operations rose 23.7% to ₹4,623.01 crore from ₹3,737.31 crore, while finance costs rose 93.2% to ₹28.31 crore and depreciation rose 39.3% to ₹89.25 crore. Finance costs are 0.6% of total income this quarter.
The exceptional items of ₹55.31 crore are shown against the year ended 31 Mar 2026. Note 7 describes them as a gain on transfer of freehold land of ₹74.04 crore, partly offset by ₹18.73 crore for the impact of implementing new labour codes.
Standalone ₹ crore
Particulars
Q2 FY27
Q2 FY26
YoY
Q1 FY27
QoQ
4,662.81
3,750.57
+24.3%
5,968.09
-21.9%
Revenue from operations
4,621.51
3,735.56
+23.7%
5,917.45
-21.9%
Other income
41.30
15.01
+175.1%
50.64
-18.4%
135.93
46.95
+189.5%
166.39
-18.3%
Finance costs
28.31
14.65
+93.2%
23.04
+22.9%
Depreciation
89.17
63.98
+39.4%
85.69
+4.1%
Tax expense
47.86
19.57
+144.6%
58.22
-17.8%
Net profit margin
2.92%
1.25%
+1.66 pp
2.79%
+0.13 pp
Tax as share of profit before tax
26.0%
29.4%
-3.38 pp
25.9%
+0.12 pp
EPS, basic (₹)
5.14
1.78
+188.8%
6.29
-18.3%
Figures are in ₹ crore; YoY compares with Q2 FY26 and QoQ with Q1 FY27. Click Total income or Net profit to see the rows behind them.
Standalone net profit rose faster than total income. It was ₹135.93 crore against ₹46.95 crore a year earlier, up 189.5%, while total income rose 24.3% to ₹4,662.81 crore. Basic EPS was ₹5.14 against ₹1.78.
Profit before tax was ₹183.79 crore against ₹66.52 crore. Tax expense was ₹47.86 crore against ₹19.57 crore, so the tax share of profit before tax fell from 29.4% to 26.0%. Other income of ₹41.30 crore is 0.9% of total income, and the notes say ₹36.89 crore of the quarter's other income is interest on income tax refunds.
Year to date, profit for the period was ₹302.32 crore against ₹230.66 crore, and net cash generated from operating activities was ₹805.16 crore against ₹453.26 crore. Depreciation rose 39.4% to ₹89.17 crore and finance costs rose 93.2% to ₹28.31 crore in the quarter.
The press release says sell-in volume rose 16% and premium volumes rose 38%, with Heineken Silver up 67% and Kingfisher Ultra up 44%. It says EBITDA margin improved 480 bps to 11.9% and EBIT margin improved 441 bps to 8.4%, and that PAT grew 31% in the first half of FY27.
Inference
The Board proposed a dividend of ₹10 a share for the year ended 31 Mar 2026, totalling ₹264.41 crore. Shareholders approved it at the AGM held on 12 Aug 2026, and it was paid during the quarter. Separately, the company has withheld ₹109.51 crore of dividend on shares held by an erstwhile director and certain other shareholders, under orders of the Debt Recovery Tribunal, Karnataka, Bangalore, and ₹45 lakh of director commission and sitting fees payable to that erstwhile director.
The CCI levied a penalty of ₹751.83 crore on the company. The Supreme Court has stayed the NCLAT order and the recovery proceedings, and ₹187.62 crore is deposited as fixed deposit receipts with the NCLAT Registrar within other non-current assets. No provision is recorded, and the company treats the penalty as a contingent liability. The auditors draw attention to this matter and say their conclusion is not modified.
At Bihar, property, plant and equipment with a carrying value of ₹55.87 crore sits on land whose lease BIADA cancelled in December 2022. The company had challenged that cancellation, has withdrawn its High Court petition, and says BIADA has assured the final approval within the next few weeks. The filing gives no reason for the rise in profit, and no amount or timing for the commercial investments the company plans in the coming quarter.
Create a free account to read the rest of this article and the analysis that follows.
By continuing you agree to our Terms and Privacy Policy, and to receive updates from Blacklitt by email. You can unsubscribe anytime.
Disclaimer:
The information available on this article is provided for education and informational purposes only. It does not constitute or provide financial, investment or trading advice and should not be construed as an endorsement of any specific stock or financial strategy in any form or manner. We do not make any representations or warranties regarding the quality, reliability, or accuracy of the information provided. This website may contain links to third-party content. We are not responsible for the content or accuracy of these external sources and do not endorse or verify the information provided by third parties. We are not liable for any decisions made or actions taken based on the information provided on this website.