Welspun Corp Q2 FY27 Results: Consolidated Net Profit ₹495 Crore on Total Income of ₹4,699 Crore
Earnings
Steel pipes
Blacklitt Research4 min read
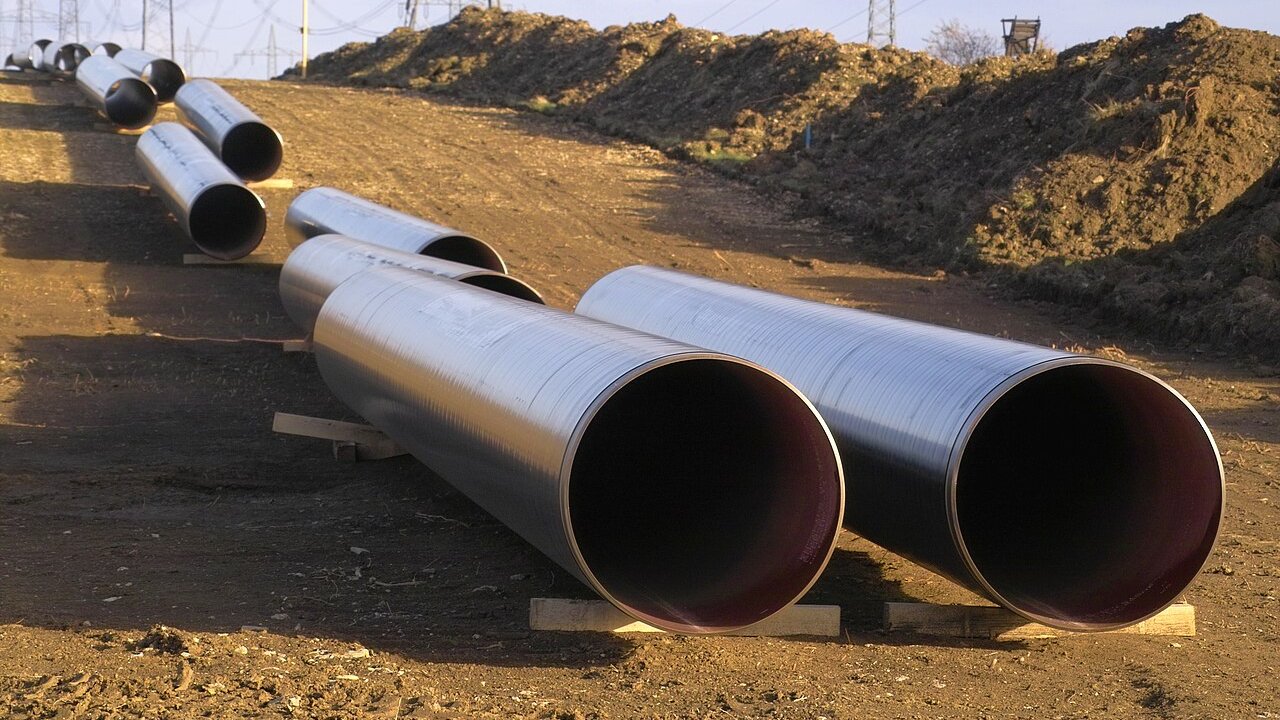
Paora, via Wikimedia Commons (CC0). Illustrative image.
Welspun Corp (NSE: WELCORP) reported consolidated total income of ₹4,698.55 crore and net profit of ₹495.09 crore for the quarter ended 30 Sep 2026, and standalone total income of ₹1,884.02 crore and net profit of ₹141.83 crore, it said in a filing on 29 Oct 2026. The company's market value is ₹65,926 crore at the 29 Oct 2026 close.
Key highlights
Consolidated
Including its subsidiaries
Total income: ₹4,698.55 crore, up 6.6% YoY and 13.4% QoQ
Net profit: ₹495.09 crore, up 11.6% YoY and down 52.8% QoQ
EPS: ₹18.91 basic, against ₹16.70 a year earlier and ₹39.68 in the quarter before
Finance costs: ₹38.41 crore, down 22.2% YoY
Standalone
The company on its own, without its subsidiaries
Total income: ₹1,884.02 crore, down 4.8% YoY and up 18.0% QoQ
Net profit: ₹141.83 crore, down 61.2% YoY and up 22.4% QoQ
EPS: ₹5.38 basic, against ₹13.89 a year earlier
Other income: ₹23.68 crore, against ₹157.64 crore a year earlier
Summary
Consolidated ₹ crore
Particulars
Q2 FY27
Q2 FY26
YoY
Q1 FY27
QoQ
4,698.55
4,408.66
+6.6%
4,144.91
+13.4%
Revenue from operations
4,643.72
4,373.61
+6.2%
4,081.12
+13.8%
Other income
54.83
35.05
+56.4%
63.79
-14.0%
495.09
443.51
+11.6%
1,047.88
-52.8%
Profit before tax
655.58
588.49
+11.4%
1,207.13
-45.7%
Finance costs
38.41
49.38
-22.2%
45.18
-15.0%
Depreciation
129.49
84.20
+53.8%
124.58
+3.9%
Tax expense
160.49
144.98
+10.7%
159.25
+0.8%
Net profit margin
10.54%
10.06%
+0.48 pp
25.28%
-14.74 pp
EPS, basic (₹)
18.91
16.70
+13.2%
39.68
-52.3%
Figures are in ₹ crore; YoY compares with Q2 FY26 and QoQ with Q1 FY27. Click Total income or Net profit to see the rows behind them.
Consolidated net profit rose 11.6% YoY, faster than total income, which rose 6.6%. Profit before tax grew 11.4%, and the tax expense rose 10.7% to ₹160.49 crore, which is 24.5% of profit before tax. Other income of ₹54.83 crore is 8.4% of profit before tax, up from ₹35.05 crore a year earlier.
Against the June quarter the picture reverses. Net profit fell 52.8% QoQ while total income rose 13.4%. The filing's notes say that in the quarter ended 30 Jun 2026 the Group sold EPIC shares for ₹723.55 crore and recognised a gain of ₹547.93 crore, so the June quarter's net profit of ₹1,047.88 crore includes that gain. The current quarter has no equivalent item in the notes.
Depreciation rose 53.8% YoY to ₹129.49 crore, while finance costs fell 22.2% to ₹38.41 crore, which is 0.8% of total income. The notes record a Welspun Captive Power Generation acquisition in the quarter for ₹67.66 crore, taking the group's holding from 22.90% to 73.90%. The filing does not say what part of the depreciation rise relates to it.
The limited review report by BSR & Co. LLP carries an unmodified conclusion. It notes 8 subsidiaries and 3 associates that were not reviewed, which the company describes as not material to the Group.
Standalone ₹ crore
Particulars
Q2 FY27
Q2 FY26
YoY
Q1 FY27
QoQ
1,884.02
1,980.05
-4.8%
1,596.70
+18.0%
Revenue from operations
1,860.34
1,822.41
+2.1%
1,567.22
+18.7%
Other income
23.68
157.64
-85.0%
29.48
-19.7%
141.83
365.75
-61.2%
115.84
+22.4%
Profit before tax
186.00
445.31
-58.2%
156.44
+18.9%
Finance costs
17.02
27.43
-38.0%
14.63
+16.3%
Depreciation
41.27
37.47
+10.1%
40.63
+1.6%
Tax expense
44.17
79.56
-44.5%
40.60
+8.8%
Net profit margin
7.53%
18.47%
-10.94 pp
7.25%
+0.27 pp
EPS, basic (₹)
5.38
13.89
-61.3%
4.39
+22.6%
Figures are in ₹ crore; YoY compares with Q2 FY26 and QoQ with Q1 FY27. Click Total income or Net profit to see the rows behind them.
Standalone net profit fell 61.2% YoY, more than the 58.2% fall in profit before tax and well ahead of the 4.8% fall in total income. Revenue from operations rose 2.1% to ₹1,860.34 crore, while other income fell from ₹157.64 crore to ₹23.68 crore, a drop of 85.0%.
The year-ago standalone quarter carried exceptional items of ₹163.49 crore, which the notes do not explain in detail for that quarter. The filing does not give the reason for the year-ago other income level.
Standalone net profit rose 22.4% QoQ, faster than total income at 18.0%. Standalone tax expense of ₹44.17 crore is 23.7% of profit before tax of ₹186.00 crore.
Consolidated net profit of ₹495.09 crore is ₹353.26 crore higher than standalone net profit of ₹141.83 crore. Consolidated total income of ₹4,698.55 crore is ₹2,814.53 crore higher than standalone total income of ₹1,884.02 crore. Consolidated net profit rose 11.6% YoY while standalone net profit fell 61.2%, so the two natures moved in opposite directions over the year.
Inference
The filing reports Board approval of a capex of USD 115 million for an additional HSAW pipe facility at Little Rock, Arkansas, expected to be operational in March 2028 and funded through internal accruals. It also reports approval of total Jordan project investment of up to USD 125 million, funded about 50:50 with Perma-Pipe, with definitive agreements to be executed in due course.
The filing gives an estimated total investment of up to ₹110 crore in Welspun Special Coating Private Limited, shared with the JV partner. The timing and cost of the definitive Jordan agreements are not stated, and the filing does not say how the Little Rock facility's output will be sold.
Create a free account to read the rest of this article and the analysis that follows.
By continuing you agree to our Terms and Privacy Policy, and to receive updates from Blacklitt by email. You can unsubscribe anytime.
Disclaimer:
The information available on this article is provided for education and informational purposes only. It does not constitute or provide financial, investment or trading advice and should not be construed as an endorsement of any specific stock or financial strategy in any form or manner. We do not make any representations or warranties regarding the quality, reliability, or accuracy of the information provided. This website may contain links to third-party content. We are not responsible for the content or accuracy of these external sources and do not endorse or verify the information provided by third parties. We are not liable for any decisions made or actions taken based on the information provided on this website.