Equity Funds Holding the Most Cash in September 2026
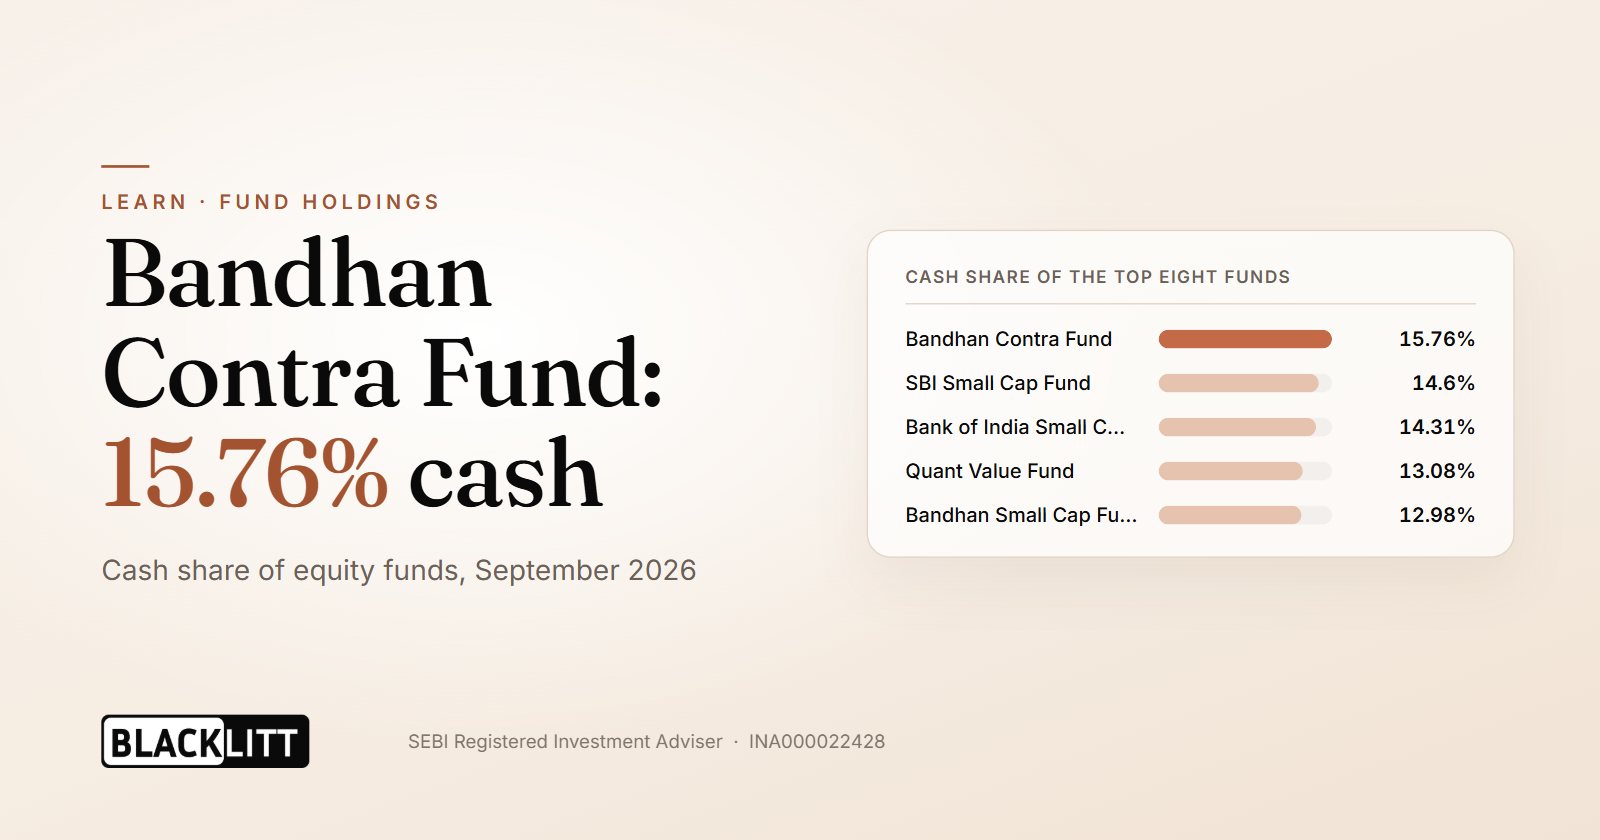
The highest cash share among the 244 equity funds considered for September 2026 belonged to Bandhan Contra Fund, at 15.76%. SBI Small Cap Fund was second at 14.6%. Contra funds, as a category, averaged 6.62% cash, the highest of any category in the data. Holdings are as of 30 September 2026.
Ten funds with the highest cash share
The table lists the ten funds with the highest cash shares among the 244 funds considered. Each fund had at least ₹1,000 crore in assets, which was the minimum for this ranking. Quant funds appear four times in the list, in the Value, Small Cap, Large & Mid Cap and Flexi Cap categories.
| Fund | Category | Assets (₹ crore) | Cash share (%) |
|---|---|---|---|
| Bandhan Contra Fund | Contra | 1,712 | 15.76 |
| SBI Small Cap Fund | Small Cap | 41,059 | 14.6 |
| Bank of India Small Cap Fund | Small Cap | 3,671 | 14.31 |
| Quant Value Fund | Value | 1,917 | 13.08 |
| Bandhan Small Cap Fund | Small Cap | 35,856 | 12.98 |
| Quant Small Cap Fund | Small Cap | 35,572 | 12.35 |
| WhiteOak Capital Mid Cap Fund | Mid Cap | 7,540 | 12.2 |
| Quant Large & Mid Cap Fund | Large & Mid Cap | 3,384 | 12.2 |
| Quant Flexi Cap Fund | Flexi Cap | 7,309 | 11.99 |
| Bank of India ELSS Tax Saver Fund | ELSS | 1,366 | 11.98 |
Data as of 30 September 2026, compared with 31 August 2026. Cash share and assets are from the monthly portfolio disclosures.
Data as of 30 September 2026.
The chart shows the top eight funds from the table, and the same values appear in the table above.
Contra funds lead the category averages
Contra funds come first on category averages, with an average cash share of 6.62%. Small Cap funds follow at 5.68%, and Focused funds at 5.38%. Eleven categories appear in the data, and the average for each is in the table below.
| Category | Average cash share (%) |
|---|---|
| Contra | 6.62 |
| Small Cap | 5.68 |
| Focused | 5.38 |
| Multi Cap | 4.13 |
| Value | 3.98 |
| Flexi Cap | 3.97 |
| Large & Mid Cap | 3.36 |
| Mid Cap | 3.32 |
| ELSS | 3.31 |
| Large Cap | 2.3 |
| Dividend Yield | 1.42 |
Data as of 30 September 2026, compared with 31 August 2026. Category averages are the figures calculated for each category in this data set.
Averages describe a category as a whole, and a single fund can sit well above or below its category average, as the top ten table shows. For how cash fits into a fund's wider mix, see what is asset allocation.
Four of the ten are small cap funds
Four of the ten funds in the first table are Small Cap funds: SBI Small Cap Fund, Bank of India Small Cap Fund, Bandhan Small Cap Fund and Quant Small Cap Fund. SBI Small Cap Fund has ₹41,059 crore in assets, the largest figure in the table. Bank of India Small Cap Fund is the smallest of the four, at ₹3,671 crore. The category average for Small Cap funds is 5.68%, below the 6.62% for Contra funds.
For a fuller view of this month's trades in small cap funds, see what small cap funds bought in September 2026.
Large cap funds were absent from the top ten
No large cap fund appears in the top ten list. Large Cap funds averaged 2.3% cash, the second lowest category average in the data. Dividend Yield funds had the lowest, at 1.42%. Mid Cap funds averaged 3.32%, and one of them, WhiteOak Capital Mid Cap Fund, appears in the top ten at 12.2%.
This data has clear limits
Holdings are disclosed monthly, and the figures here come from those disclosures. A monthly snapshot shows cash on one date only. It does not show trades made and reversed inside the month, or what a fund held on other days. A high cash share is one fund's position at one date, not a recommendation to buy or sell any fund.
Frequently asked questions
Which fund held the most cash in September 2026?
Bandhan Contra Fund held the highest cash share among the 244 equity funds considered, at 15.76% as of 30 September 2026. The fund is in the Contra category and has ₹1,712 crore in assets. SBI Small Cap Fund was next at 14.6%. The figures come from monthly portfolio disclosures.
Which category held the most cash on average?
Contra funds held the highest category average cash share, at 6.62%, followed by Small Cap at 5.68% and Focused at 5.38%. Dividend Yield funds had the lowest average, at 1.42%, and Large Cap funds averaged 2.3%. All figures are as of 30 September 2026.
Where can I see a mutual fund's holdings?
Fund houses publish monthly portfolio disclosures on their websites within 10 days of month-end, as SEBI requires. The holdings for a given month are as of its last day, so check the date on the document before comparing months. The data in this article uses the disclosures for 30 September 2026 and 31 August 2026.
Disclaimer
Mutual Fund investments are subject to market risks, read all scheme related documents carefully.
The funds on this page are shown for information and education, with figures as of 30 September 2026. Past performance does not indicate future returns. This is not personalised investment advice or a recommendation to buy or sell any fund, so check that a fund suits your own goals, time horizon and risk appetite, or speak to an adviser, before you invest.
Registration granted by SEBI, membership of BASL and certification from NISM in no way guarantee performance of the intermediary or provide any assurance of returns to investors.
Blacklitt Technologies Private Limited · SEBI RIA INA000022428 · BSE enlistment 2491