Kirloskar Ferrous Industries Q2 FY27 Results: Consolidated Net Profit ₹97.54 Crore on Total Income of ₹2,066 Crore
Earnings
Iron castings, tubes and steel
Blacklitt Research3 min read
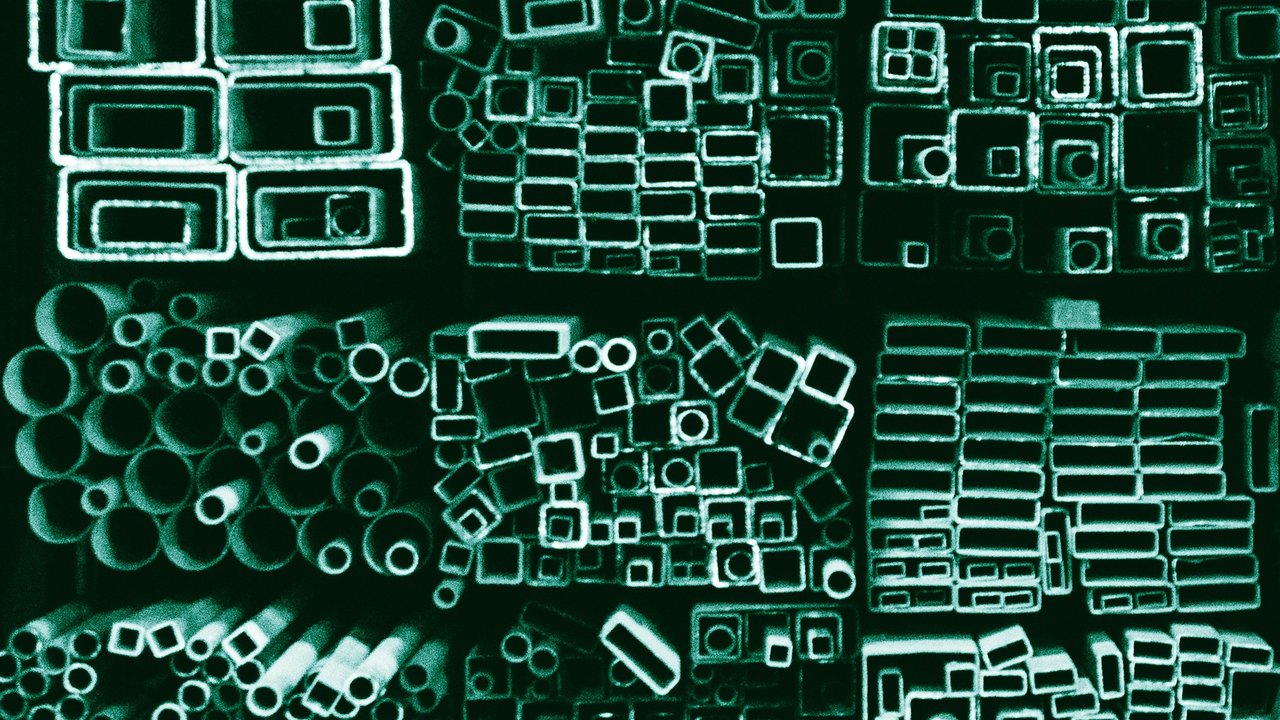
Photo by Zoshua Colah on Unsplash (Unsplash License). Illustrative image.
Kirloskar Ferrous Industries reported consolidated total income of ₹2,066.02 crore and net profit of ₹97.54 crore for the quarter ended 30 Sep 2026. Standalone total income was ₹2,066.02 crore and standalone net profit ₹97.57 crore. The company said in a filing on 30 Oct 2026.
Key highlights
Consolidated
Including its subsidiaries
Total income: ₹2,066.02 crore, up 17.4% YoY and 15.5% QoQ
Net profit and EPS: ₹97.54 crore, up 10.2% YoY; basic EPS ₹5.91 against ₹5.38
Finance costs: ₹34.01 crore, up 4.4% YoY
Tax expense: ₹40.21 crore, up 28.3% YoY; 29.2% of profit before tax
Standalone
The company on its own, without its subsidiaries
Total income: ₹2,066.02 crore, up 17.4% YoY and 15.5% QoQ
Net profit and EPS: ₹97.57 crore, up 10.2% YoY; basic EPS ₹5.91 against ₹5.38
Finance costs: ₹34.01 crore, up 4.4% YoY
Tax expense: ₹40.21 crore, up 28.3% YoY; 29.2% of profit before tax
Summary
Consolidated ₹ crore
Particulars
Q2 FY27
Q2 FY26
YoY
Q1 FY27
QoQ
2,066.02
1,759.75
+17.4%
1,788.94
+15.5%
Revenue from operations
2,046.68
1,755.32
+16.6%
1,771.51
+15.5%
Other income
19.34
4.43
+336.6%
17.43
+11.0%
97.54
88.54
+10.2%
82.34
+18.5%
Profit before tax
137.75
119.88
+14.9%
105.11
+31.1%
Finance costs
34.01
32.59
+4.4%
29.47
+15.4%
Depreciation
70.56
66.38
+6.3%
69.26
+1.9%
Tax expense
40.21
31.34
+28.3%
22.77
+76.6%
Net profit margin
4.72%
5.03%
-0.31 pp
4.60%
+0.12 pp
EPS, basic (₹)
5.91
5.38
+9.9%
4.99
+18.4%
Figures are in ₹ crore; YoY compares with Q2 FY26 and QoQ with Q1 FY27. Click Total income or Net profit to see the rows behind them.
Tax expense grew faster than profit before tax: up 28.3% YoY against 14.9%. Net profit rose 10.2% to ₹97.54 crore, and tax was 29.2% of profit before tax of ₹137.75 crore this quarter. The statement shows current tax of ₹20.92 crore and deferred tax of ₹19.24 crore for the quarter.
Other income was ₹19.34 crore, against ₹4.43 crore a year earlier and ₹17.43 crore in the June quarter. It is 0.9% of total income. Other income is 14.0% of profit before tax this quarter.
Finance costs and depreciation grew more slowly than total income: finance costs rose 4.4% to ₹34.01 crore and depreciation rose 6.3% to ₹70.56 crore, against total income up 17.4%. Finance costs are 1.6% of total income this quarter.
The June quarter column carries an exceptional item of ₹29.33 crore, which the notes describe as stamp duty and associated expenses for the ISMT merger scheme. The September quarter column shows a dash for that line. Profit before tax rose 31.1% from the June quarter, a figure stated after that exceptional item, and net profit rose 18.5%, faster than total income's 15.5%.
Standalone ₹ crore
Particulars
Q2 FY27
Q2 FY26
YoY
Q1 FY27
QoQ
2,066.02
1,759.75
+17.4%
1,788.94
+15.5%
Revenue from operations
2,046.68
1,755.32
+16.6%
1,771.51
+15.5%
Other income
19.34
4.43
+336.6%
17.43
+11.0%
97.57
88.52
+10.2%
82.32
+18.5%
Profit before tax
137.78
119.86
+15.0%
105.09
+31.1%
Finance costs
34.01
32.59
+4.4%
29.47
+15.4%
Depreciation
70.56
66.38
+6.3%
69.26
+1.9%
Tax expense
40.21
31.34
+28.3%
22.77
+76.6%
Net profit margin
4.72%
5.03%
-0.31 pp
4.60%
+0.12 pp
EPS, basic (₹)
5.91
5.38
+9.9%
4.99
+18.4%
Figures are in ₹ crore; YoY compares with Q2 FY26 and QoQ with Q1 FY27. Click Total income or Net profit to see the rows behind them.
Tax expense grew faster than profit before tax: up 28.3% YoY against 15.0%. Standalone net profit rose 10.2% to ₹97.57 crore, and tax was 29.2% of standalone profit before tax of ₹137.78 crore this quarter.
Other income was ₹19.34 crore, against ₹4.43 crore a year earlier and ₹17.43 crore in the June quarter. It is 0.9% of total income and 14.0% of standalone profit before tax.
Finance costs rose 4.4% to ₹34.01 crore and depreciation rose 6.3% to ₹70.56 crore, both more slowly than total income's 17.4% YoY rise. Finance costs are 1.6% of total income this quarter.
The standalone statement carries the same ₹29.33 crore exceptional item in the June quarter column and shows a dash for the September quarter. Standalone profit before tax rose 31.1% from the June quarter, a figure stated after that item, and net profit rose 18.5%, faster than total income's 15.5%.
Inference
The filing says the Company raised ₹450 crore through commercial papers in the quarter, used for working capital requirements and general corporate purposes, and that ₹445.13 crore was outstanding on 30 Sep 2026. Standalone net worth was ₹2,606.69 crore and the standalone debt-equity ratio was 0.32 times for the quarter.
The statutory auditor, PG Bhagwat LLP, says its review conclusion on both sets of results is not modified. The notes say a deferred tax asset recognised on the merger scheme's appointed date of 1 Apr 2025 has been utilised across previous quarters and the current quarter and six months ended 30 Sep 2026.
Standalone net cash from operating activities was ₹98.27 crore for the six months ended 30 Sep 2026, against ₹215.68 crore a year earlier, and dividends paid were ₹49.50 crore. A reader would want the reasons behind the rise in revenue and tax expense, and this filing does not set them out.
Create a free account to read the rest of this article and the analysis that follows.
By continuing you agree to our Terms and Privacy Policy, and to receive updates from Blacklitt by email. You can unsubscribe anytime.
Disclaimer:
The information available on this article is provided for education and informational purposes only. It does not constitute or provide financial, investment or trading advice and should not be construed as an endorsement of any specific stock or financial strategy in any form or manner. We do not make any representations or warranties regarding the quality, reliability, or accuracy of the information provided. This website may contain links to third-party content. We are not responsible for the content or accuracy of these external sources and do not endorse or verify the information provided by third parties. We are not liable for any decisions made or actions taken based on the information provided on this website.


 KIRLFERKirloskar Ferrous Industries Ltd.