Unimech Aerospace and Manufacturing Q2 FY27 Results: Consolidated Net Profit ₹31.77 Crore on Total Income of ₹130 Crore
Earnings
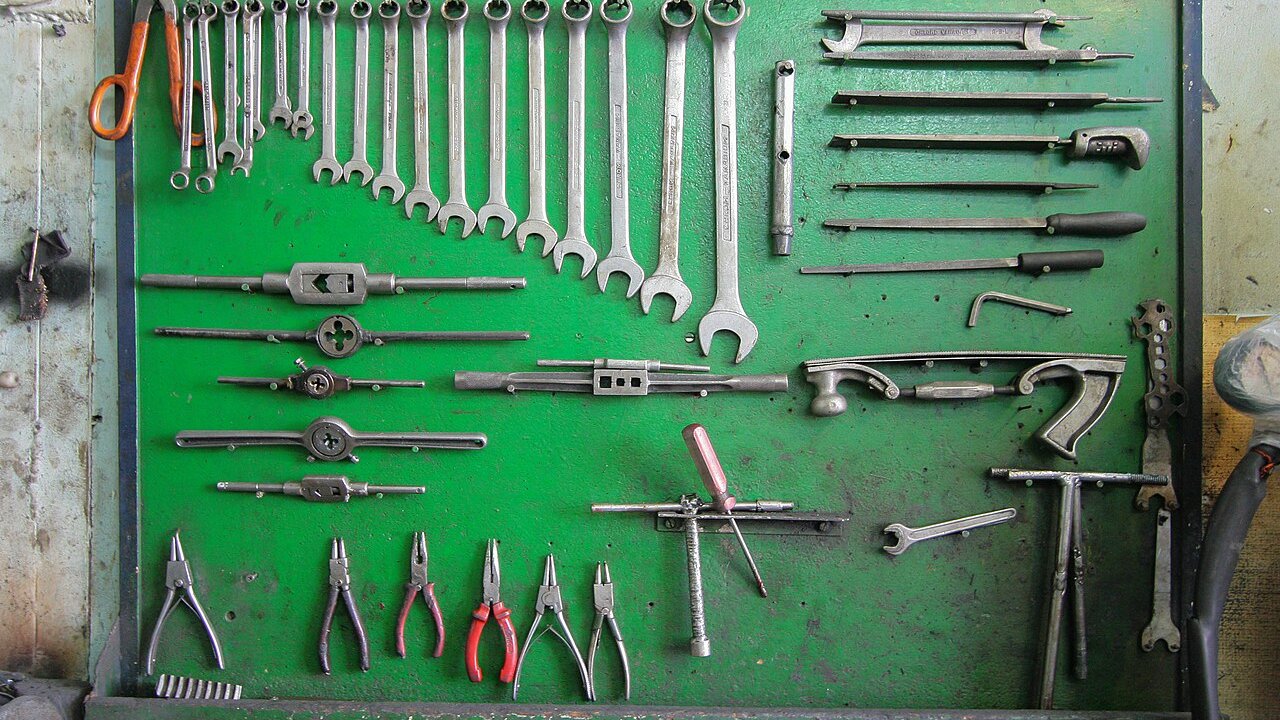
tools and engineering components
Blacklitt Research4 min read
Mostafameraji, via Wikimedia Commons (CC0). Illustrative image.
Unimech Aerospace and Manufacturing reported consolidated total income of ₹129.98 crore and net profit of ₹31.77 crore for the quarter ended 30 Sep 2026, it said in a filing on 27 Oct 2026. On a standalone basis, total income was ₹24.05 crore and net profit ₹8.53 crore.
Key highlights
Consolidated
Including its subsidiaries
Total income: ₹129.98 crore, up 80.9% YoY and 13.1% QoQ.
Net profit and EPS: ₹31.77 crore, up 102.8% YoY; basic EPS ₹6.24 against ₹3.08 a year earlier.
Finance costs: ₹2.03 crore, up 46.2% YoY and 5.0% QoQ.
Standalone
The company on its own, without its subsidiaries
Total income: ₹24.05 crore, down 5.3% YoY and up 67.3% QoQ.
Net profit and EPS: ₹8.53 crore, up 43.6% YoY; basic EPS ₹1.68 against ₹1.17 a year earlier.
Other income: ₹7.10 crore, down 31.4% YoY and 29.5% of total income.
Summary
Consolidated ₹ crore
Particulars
Q2 FY27
Q2 FY26
YoY
Q1 FY27
QoQ
129.98
71.85
+80.9%
114.95
+13.1%
Revenue from operations
123.00
61.98
+98.4%
107.62
+14.3%
Other income
6.98
9.87
-29.3%
7.33
-4.8%
31.77
15.67
+102.8%
27.86
+14.0%
Profit before tax
44.91
20.68
+117.2%
36.69
+22.4%
Finance costs
2.03
1.39
+46.2%
1.94
+5.0%
Depreciation
9.04
6.34
+42.6%
7.96
+13.7%
Tax expense
12.38
4.90
+152.6%
8.69
+42.5%
Net profit margin
24.45%
21.81%
+2.64 pp
24.24%
+0.21 pp
EPS, basic (₹)
6.24
3.08
+102.6%
5.48
+13.9%
Figures are in ₹ crore; YoY compares with Q2 FY26 and QoQ with Q1 FY27. Click Total income or Net profit to see the rows behind them.
Consolidated net profit rose 102.8% to ₹31.77 crore, faster than total income, which rose 80.9% to ₹129.98 crore. Profit before tax rose 117.2% to ₹44.91 crore, and net profit grew more slowly than profit before tax. Tax expense was ₹12.38 crore, 27.6% of profit before tax, against ₹4.90 crore a year earlier. Net profit is after the Group's share of a loss of ₹75.35 lakh from Dheya Engineering Technologies Private Limited, an associate.
Revenue from operations rose 98.4% to ₹123.00 crore, while other income fell 29.3% to ₹6.98 crore. Other income was 5.4% of total income this quarter. Finance costs of ₹2.03 crore were 1.6% of total income, and depreciation rose 42.6% to ₹9.04 crore.
Against the quarter ended 30 Jun 2026, total income rose 13.1% and net profit rose 14.0%, faster than total income. Basic EPS was ₹6.24 against ₹5.48 in that quarter and ₹3.08 a year earlier. The figures for the quarter ended 30 Sep 2026 are the balancing figures between the unaudited six-month figures and the published figures for the quarter ended 30 Jun 2026.
Standalone ₹ crore
Particulars
Q2 FY27
Q2 FY26
YoY
Q1 FY27
QoQ
24.05
25.38
-5.3%
14.37
+67.3%
Revenue from operations
16.95
15.04
+12.7%
4.59
+269.3%
Other income
7.10
10.34
-31.4%
9.78
-27.5%
8.53
5.94
+43.6%
2.20
+287.3%
Profit before tax
10.45
8.80
+18.7%
3.00
+248.4%
Finance costs
0.51
0.40
+26.9%
0.41
+24.0%
Depreciation
2.62
2.21
+18.5%
2.37
+10.5%
Tax expense
1.93
2.87
-32.8%
0.80
+141.2%
Net profit margin
35.45%
23.39%
+12.06 pp
15.32%
+20.13 pp
EPS, basic (₹)
1.68
1.17
+43.6%
0.43
+290.7%
Figures are in ₹ crore; YoY compares with Q2 FY26 and QoQ with Q1 FY27. Click Total income or Net profit to see the rows behind them.
Standalone net profit rose 43.6% to ₹8.53 crore, while total income fell 5.3% to ₹24.05 crore from ₹25.38 crore a year earlier. Net profit rose faster than profit before tax, which was ₹10.45 crore, up 18.7%.
Revenue from operations rose 12.7% to ₹16.95 crore, while other income fell 31.4% to ₹7.10 crore. Other income was 29.5% of total income and 67.9% of profit before tax of ₹10.45 crore. Tax expense of ₹1.93 crore was 18.4% of profit before tax, against ₹2.87 crore a year earlier.
Against the quarter ended 30 Jun 2026, total income rose 67.3% from ₹14.37 crore and revenue from operations rose 269.3% from ₹4.59 crore. Net profit rose 287.3% from ₹2.20 crore, faster than total income, and basic EPS was ₹1.68 against ₹0.43 in that quarter.
Inference
The Board approved on 27 Oct 2026 the acquisition of 60,80,000 equity shares of Hobel Bellows Private Limited from Innomech Aerospace Toolings Private Limited, a wholly owned subsidiary, under an internal group restructuring. The Board said the transaction is intended to simplify and streamline the Group's holding structure. Additional information will be submitted after the acquisition is completed, and the consolidated statement already includes Hobel Bellows Private Limited and Hobel Bellows Co. from 27 Apr 2026.
The Company made an overseas direct investment of ₹39.36 crore on 1 Oct 2026 for a 51% stake in Kanoo Unimech Advanced Manufacturing Solutions, Kingdom of Saudi Arabia. In the quarter it bought 850 shares of Dheya Engineering Technologies Private Limited through a secondary purchase, and its stake in Dheya stood at 27.24% at 30 Sep 2026. The consolidated balance sheet shows goodwill of ₹321.99 crore, and the filing does not say what consideration is payable for the Hobel Bellows shares or what business the ₹424.80 crore purchase of partnership interest covers.
Prathap B. Naidu, Senior Management, is promoted from Assistant General Manager to General Manager with effect from 1 Nov 2026 and is transferred to Innomech Aerospace Toolings Private Limited, ceasing to be Senior Management from the same date. The promotion is to entrust him with overall responsibility for the Toolings Division. The statutory auditor's limited review, dated 27 Oct 2026, reports that nothing has come to its attention that the statements contain a material misstatement.
Create a free account to read the rest of this article and the analysis that follows.
By continuing you agree to our Terms and Privacy Policy, and to receive updates from Blacklitt by email. You can unsubscribe anytime.
Disclaimer:
The information available on this article is provided for education and informational purposes only. It does not constitute or provide financial, investment or trading advice and should not be construed as an endorsement of any specific stock or financial strategy in any form or manner. We do not make any representations or warranties regarding the quality, reliability, or accuracy of the information provided. This website may contain links to third-party content. We are not responsible for the content or accuracy of these external sources and do not endorse or verify the information provided by third parties. We are not liable for any decisions made or actions taken based on the information provided on this website.


 UNIMECHUnimech Aerospace and Manufacturing Ltd.