Varun Beverages Q2 FY27 Results: Consolidated Net Profit ₹831 Crore on Total Income of ₹6,935 Crore
Earnings
beverages
Blacklitt Research4 min read
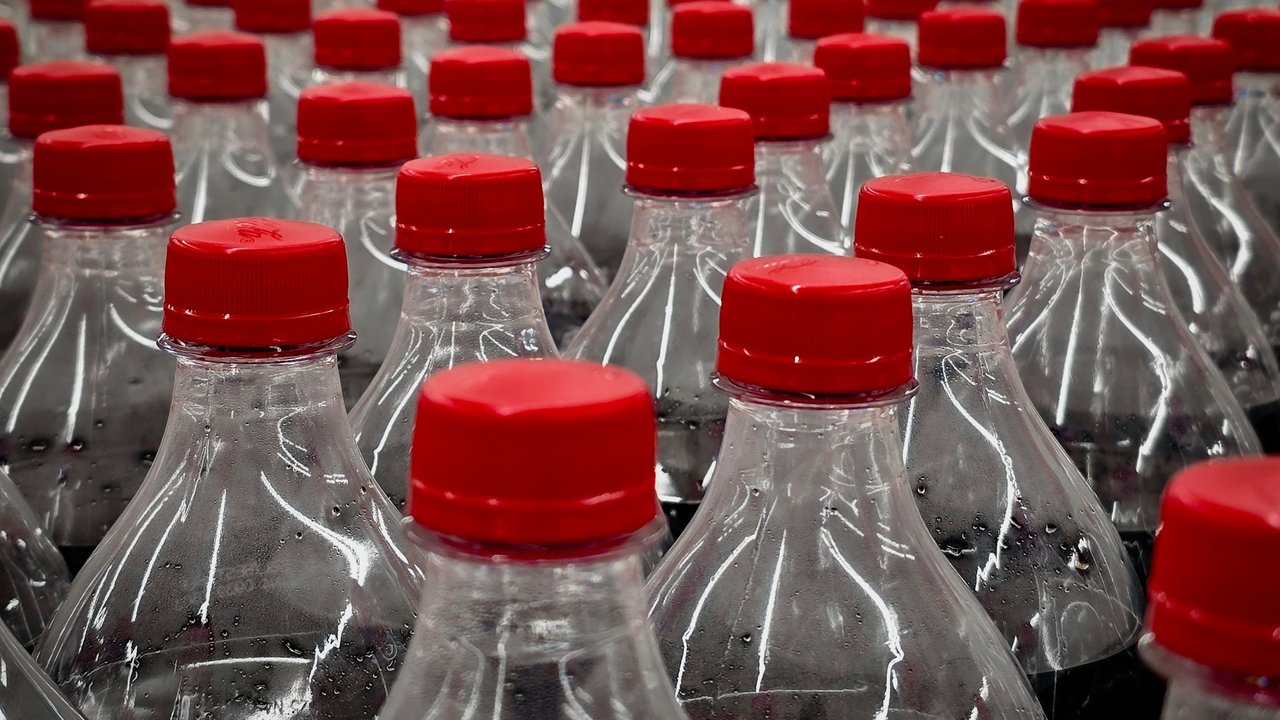
Photo by KC Shum on Unsplash (Unsplash License). Illustrative image.
Varun Beverages (NSE: VBL) said in a filing on 30 Oct 2026 that consolidated total income for the quarter ended 30 Sep 2026 was ₹6,935.45 crore and net profit was ₹830.59 crore. Standalone total income was ₹3,965.94 crore and net profit was ₹658.53 crore.
Key highlights
Consolidated
Including its subsidiaries
Total income: ₹6,935.45 crore, up 31.9% YoY and down 21.6% QoQ
Net profit and EPS: ₹830.59 crore, up 13.5% YoY; basic EPS ₹2.45, up 14.0% YoY
Finance costs: ₹71.69 crore, up 53.5% YoY
Dividend: 3rd interim dividend of ₹0.50 a share; record date 5 Nov 2026, paid from 7 Nov 2026
Standalone
The company on its own, without its subsidiaries
Total income: ₹3,965.94 crore, up 23.4% YoY and down 35.0% QoQ
Net profit and EPS: ₹658.53 crore, up 14.1% YoY; basic EPS ₹1.95, up 14.0% YoY
Other income: ₹143.50 crore, down 4.1% YoY
Finance costs: ₹7.93 crore, down 0.1% YoY
Summary
Consolidated ₹ crore
Particulars
Q2 FY27
Q2 FY26
YoY
Q1 FY27
QoQ
6,935.45
5,260.00
+31.9%
8,849.59
-21.6%
Revenue from operations
6,815.59
5,112.44
+33.3%
8,744.74
-22.1%
Other income
119.86
147.56
-18.8%
104.85
+14.3%
830.59
731.51
+13.5%
1,509.67
-45.0%
Profit before tax
1,052.62
927.23
+13.5%
1,961.49
-46.3%
Finance costs
71.69
46.71
+53.5%
58.65
+22.2%
Depreciation
419.98
312.36
+34.5%
412.71
+1.8%
Tax expense
222.02
195.72
+13.4%
451.82
-50.9%
Net profit margin
11.98%
13.91%
-1.93 pp
17.06%
-5.08 pp
EPS, basic (₹)
2.45
2.15
+14.0%
4.45
-44.9%
Figures are in ₹ crore; YoY compares with Q2 FY26 and QoQ with Q1 FY27. Click Total income or Net profit to see the rows behind them.
Consolidated net profit rose 13.5% YoY to ₹830.59 crore, slower than total income, which rose 31.9% to ₹6,935.45 crore. Revenue from operations rose 33.3% to ₹6,815.59 crore, while other income fell 18.8% to ₹119.86 crore. Against the quarter ended 30 Jun 2026, net profit fell 45.0% and total income fell 21.6%, so net profit fell more than total income.
Finance costs rose 53.5% to ₹71.69 crore and depreciation rose 34.5% to ₹419.98 crore. Finance costs are 1.0% of total income this quarter, and other income is 1.7% of total income.
Profit before tax rose 13.5% to ₹1,052.62 crore. Tax expense rose 13.4% to ₹222.02 crore, which is 21.1% of profit before tax. The net profit margin was 11.98%, against 13.91% a year earlier.
Note 10 says the comparative figures for the quarter ended 30 Jun 2026, the quarter and nine months ended 30 Sep 2025 and the year ended 31 Dec 2025 have been restated for the acquisition of the Devyani Food Industries (Kenya) business by VBL Industries (Kenya) Limited with effect from 1 Aug 2026. The year-earlier quarter is therefore one of the restated periods. Both review reports carry unmodified conclusions, and for the restatement the consolidated review relies on the report of another auditor.
Standalone ₹ crore
Particulars
Q2 FY27
Q2 FY26
YoY
Q1 FY27
QoQ
3,965.94
3,213.68
+23.4%
6,100.60
-35.0%
Revenue from operations
3,822.45
3,063.98
+24.8%
5,996.21
-36.3%
Other income
143.50
149.69
-4.1%
104.39
+37.5%
658.53
577.40
+14.1%
1,324.33
-50.3%
Profit before tax
851.79
756.53
+12.6%
1,755.12
-51.5%
Finance costs
7.93
7.94
-0.1%
3.94
+101.1%
Depreciation
201.91
172.03
+17.4%
223.50
-9.7%
Tax expense
193.26
179.12
+7.9%
430.79
-55.1%
Net profit margin
16.60%
17.97%
-1.36 pp
21.71%
-5.10 pp
EPS, basic (₹)
1.95
1.71
+14.0%
3.92
-50.3%
Figures are in ₹ crore; YoY compares with Q2 FY26 and QoQ with Q1 FY27. Click Total income or Net profit to see the rows behind them.
Standalone net profit rose 14.1% YoY to ₹658.53 crore, slower than total income, which rose 23.4% to ₹3,965.94 crore. Revenue from operations rose 24.8% to ₹3,822.45 crore, and other income fell 4.1% to ₹143.50 crore. Against the quarter ended 30 Jun 2026, net profit fell 50.3% and total income fell 35.0%, so net profit fell more than total income.
Finance costs were ₹7.93 crore against ₹7.94 crore a year earlier, and depreciation rose 17.4% to ₹201.91 crore. Finance costs are 0.2% of total income this quarter.
Profit before tax rose 12.6% to ₹851.79 crore, and net profit rose 14.1%, faster than profit before tax. Tax expense rose 7.9% to ₹193.26 crore, which is 22.7% of profit before tax. The net profit margin was 16.60%, against 17.97% a year earlier.
Other income is 16.8% of profit before tax of ₹851.79 crore this quarter, and the standalone results carry the same unmodified review conclusion as the consolidated results.
Inference
The filing says the Board approved a 3rd interim dividend of ₹0.50 a share for FY2026 on 338,24,94,644 equity shares. The record date is 5 Nov 2026 and payment starts on 7 Nov 2026. The filing does not give the reason for the fall in revenue from operations against the quarter ended 30 Jun 2026.
Note 9 says Bevco acquired 100% of Twizza Proprietary Limited at an enterprise value of ZAR 2,053 million, effective 18 Mar 2026, with consolidation provisional pending fair values. Twizza merged into Bevco with effect from 1 Aug 2026.
Note 8 says the Crickley Dairy Proprietary Limited acquisition, at an enterprise value of ZAR 238 million, was not consummated: the filing says certain conditions precedent were not fulfilled, and the sellers have referred the transaction to the Arbitration Foundation of Southern Africa. Note 7 says a Mondelez distribution agreement for Zimbabwe takes effect on 1 Oct 2026.
Create a free account to read the rest of this article and the analysis that follows.
By continuing you agree to our Terms and Privacy Policy, and to receive updates from Blacklitt by email. You can unsubscribe anytime.
Disclaimer:
The information available on this article is provided for education and informational purposes only. It does not constitute or provide financial, investment or trading advice and should not be construed as an endorsement of any specific stock or financial strategy in any form or manner. We do not make any representations or warranties regarding the quality, reliability, or accuracy of the information provided. This website may contain links to third-party content. We are not responsible for the content or accuracy of these external sources and do not endorse or verify the information provided by third parties. We are not liable for any decisions made or actions taken based on the information provided on this website.