Waaree Energies Q2 FY27 Results: Consolidated Net Profit ₹754 Crore on Total Income of ₹7,665 Crore
Earnings
solar PV manufacturing
Blacklitt Research4 min read
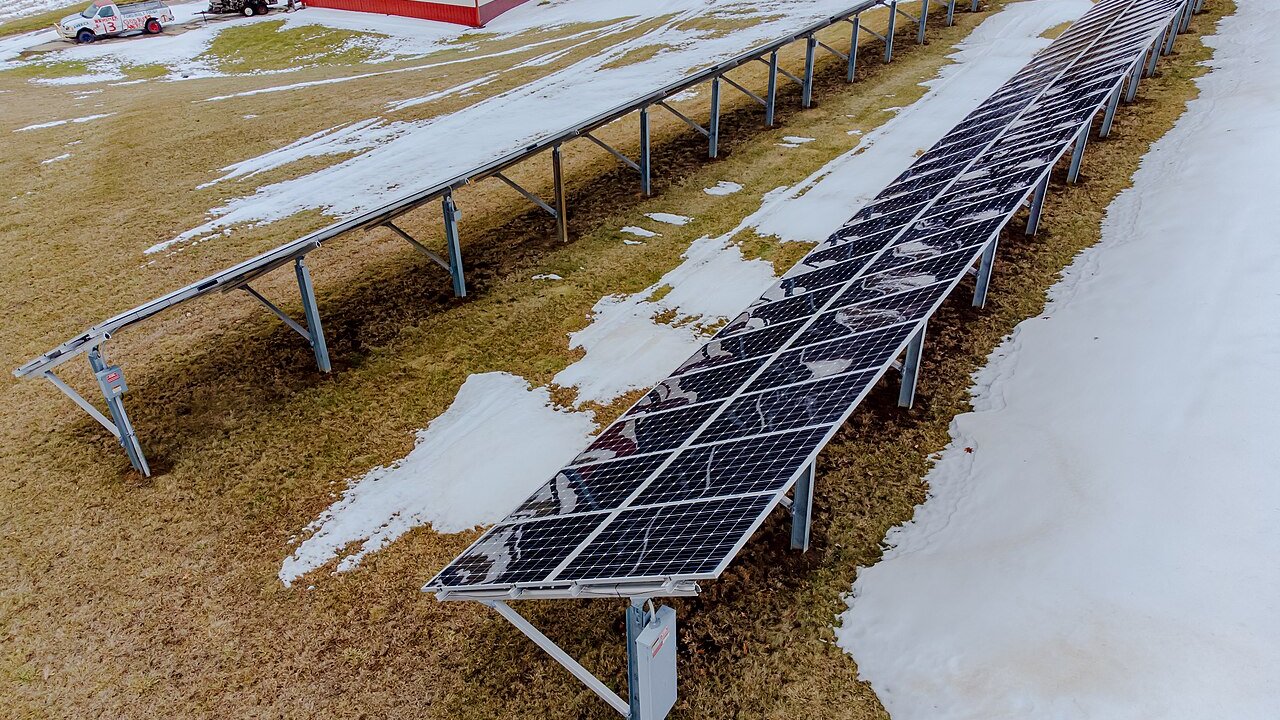
Wikideas1, via Wikimedia Commons (CC0). Illustrative image.
In a filing on 27 Oct 2026, Waaree Energies said consolidated total income for the quarter ended 30 Sep 2026 was ₹7,664.81 crore and net profit was ₹753.64 crore. Standalone total income was ₹4,759.14 crore and net profit was ₹670.88 crore.
Key highlights
Consolidated
Including its subsidiaries
Total income: ₹7,664.81 crore, up 23.1% YoY and down 5.4% QoQ
Net profit and EPS: ₹753.64 crore, down 14.2% YoY; basic EPS ₹24.98 against ₹29.33 a year earlier
US CBP provision: ₹294.78 crore (USD 32.782 million) provision in the notes; the statement shows an exceptional item of ₹294.78 crore
IEEPA duty refund: ₹360.40 crore recognised as other operating revenue, net of amount due to customer
Standalone
The company on its own, without its subsidiaries
Total income: ₹4,759.14 crore, down 10.5% YoY and 25.8% QoQ
Net profit and EPS: ₹670.88 crore, down 42.1% YoY; basic EPS ₹23.33 against ₹40.36 a year earlier
Other income: ₹181.59 crore against ₹734.54 crore a year earlier, down 75.3%
IEEPA duty refund: ₹282.30 crore recognised as other operating revenue, net of amount due to customer
Summary
Consolidated ₹ crore
Particulars
Q2 FY27
Q2 FY26
YoY
Q1 FY27
QoQ
7,664.81
6,226.54
+23.1%
8,102.60
-5.4%
Revenue from operations
7,517.74
6,065.64
+23.9%
7,931.79
-5.2%
Other income
147.07
160.90
-8.6%
170.81
-13.9%
753.64
878.21
-14.2%
891.87
-15.5%
Finance costs
105.26
96.08
+9.6%
70.37
+49.6%
Depreciation
347.26
239.76
+44.8%
329.98
+5.2%
Tax expense
276.11
353.25
-21.8%
318.51
-13.3%
Net profit margin
9.83%
14.10%
-4.27 pp
11.01%
-1.17 pp
Tax as share of profit before tax
26.8%
28.7%
-1.87 pp
26.3%
+0.50 pp
EPS, basic (₹)
24.98
29.33
-14.8%
29.56
-15.5%
Figures are in ₹ crore; YoY compares with Q2 FY26 and QoQ with Q1 FY27. Click Total income or Net profit to see the rows behind them.
Consolidated total income rose 23.1% year on year, but net profit fell 14.2%. Revenue from operations grew faster, at 23.9%, while other income fell 8.6% to ₹147.07 crore. Depreciation rose 44.8% to ₹347.26 crore and finance costs rose 9.6% to ₹105.26 crore.
The notes say that during the period the company received a notice of determination of evasion from the US Customs and Border Protection (CBP) and recognised a provision of ₹294.78 crore (USD 32.782 million). The investigation, under the Enforce and Protect Act (EAPA), concerns the origin of components used in solar modules made in India and exported to the USA since January 2021. The statement shows an exceptional item of ₹294.78 crore, referenced to Note 5. The company has filed for administrative review and is awaiting a response, and no further adjustments have been made pending the outcome.
SR BC & Co LLP reviewed the consolidated results and its conclusion is not modified, but it draws attention to Note 5 on the uncertainty over the outcome of the CBP investigation. Tax expense fell 21.8% to ₹276.11 crore, and tax was 26.8% of profit before tax against 28.7% a year earlier.
Standalone ₹ crore
Particulars
Q2 FY27
Q2 FY26
YoY
Q1 FY27
QoQ
4,759.14
5,316.38
-10.5%
6,416.59
-25.8%
Revenue from operations
4,577.55
4,581.84
-0.1%
6,221.67
-26.4%
Other income
181.59
734.54
-75.3%
194.92
-6.8%
670.88
1,159.53
-42.1%
739.10
-9.2%
Finance costs
41.11
57.64
-28.7%
41.04
+0.2%
Depreciation
191.12
183.06
+4.4%
199.23
-4.1%
Tax expense
212.20
376.41
-43.6%
253.83
-16.4%
Net profit margin
14.10%
21.81%
-7.71 pp
11.52%
+2.58 pp
Tax as share of profit before tax
24.0%
24.5%
-0.48 pp
25.6%
-1.53 pp
EPS, basic (₹)
23.33
40.36
-42.2%
25.69
-9.2%
Figures are in ₹ crore; YoY compares with Q2 FY26 and QoQ with Q1 FY27. Click Total income or Net profit to see the rows behind them.
Standalone total income fell 10.5% year on year to ₹4,759.14 crore, while net profit fell 42.1% to ₹670.88 crore. Net profit fell more than total income. Revenue from operations was down 0.1% at ₹4,577.55 crore, while other income fell 75.3% to ₹181.59 crore from ₹734.54 crore.
Standalone profit before tax was ₹883.08 crore, against ₹992.93 crore in the previous quarter and ₹1,535.94 crore a year earlier. Finance costs fell 28.7% to ₹41.11 crore, and depreciation rose 4.4% to ₹191.12 crore. Basic EPS was ₹23.33, against ₹25.69 in the previous quarter.
The same notes give the ₹294.78 crore (USD 32.782 million) provision and say CBP affirmed the company's position about not using Chinese cells in exports over the period, while highlighting certain entries for further review.
Inference
As at 30 Sep 2026, ₹2,838.13 crore of the ₹3,600.00 crore fresh-issue proceeds from the IPO had been used, 78.8% of the total, and ₹761.87 crore was unutilised and held in fixed deposits of scheduled commercial banks. By object, ₹2,049.74 crore of the ₹2,775.00 crore for part financing the Sangam Solar One project was used, ₹697.70 crore for general corporate purposes was fully used, and ₹90.69 crore of ₹127.30 crore for offer expenses was used.
The board approved the acquisition of 100% of Waaree Green Data Centers Private Limited and its two subsidiaries, Aurovault Data Centers Private Limited and Sunstar Data Centers Private Limited, from the subsidiary Waaree Renewable Technologies Limited, for cash of ₹1 lakh for 10,000 shares. The deal is described as a related party transaction done at arm's length, the companies are yet to commence operations, and FY 2026-27 is the indicative completion period. Also pending is a scheme to amalgamate the subsidiary Indosolar Limited, subject to NCLT approval, and the Associated Power Structures acquisition (55% for ₹1,225.00 crore) is included from 18 Jun 2026.
The seller in the Enel Green Power India Private Limited (EGPIPL) share purchase agreement has started arbitration claiming up to ₹792.00 crore, the company disputes the claims, and proceedings are in progress. Reasons are not given for the fall in standalone other income, from ₹734.54 crore to ₹181.59 crore, nor for how the IEEPA refund splits across quarters.
Create a free account to read the rest of this article and the analysis that follows.
By continuing you agree to our Terms and Privacy Policy, and to receive updates from Blacklitt by email. You can unsubscribe anytime.
Disclaimer:
The information available on this article is provided for education and informational purposes only. It does not constitute or provide financial, investment or trading advice and should not be construed as an endorsement of any specific stock or financial strategy in any form or manner. We do not make any representations or warranties regarding the quality, reliability, or accuracy of the information provided. This website may contain links to third-party content. We are not responsible for the content or accuracy of these external sources and do not endorse or verify the information provided by third parties. We are not liable for any decisions made or actions taken based on the information provided on this website.


 WAAREEENERWaaree Energies Ltd.