
Should You Stop a SIP in a Market Crash?
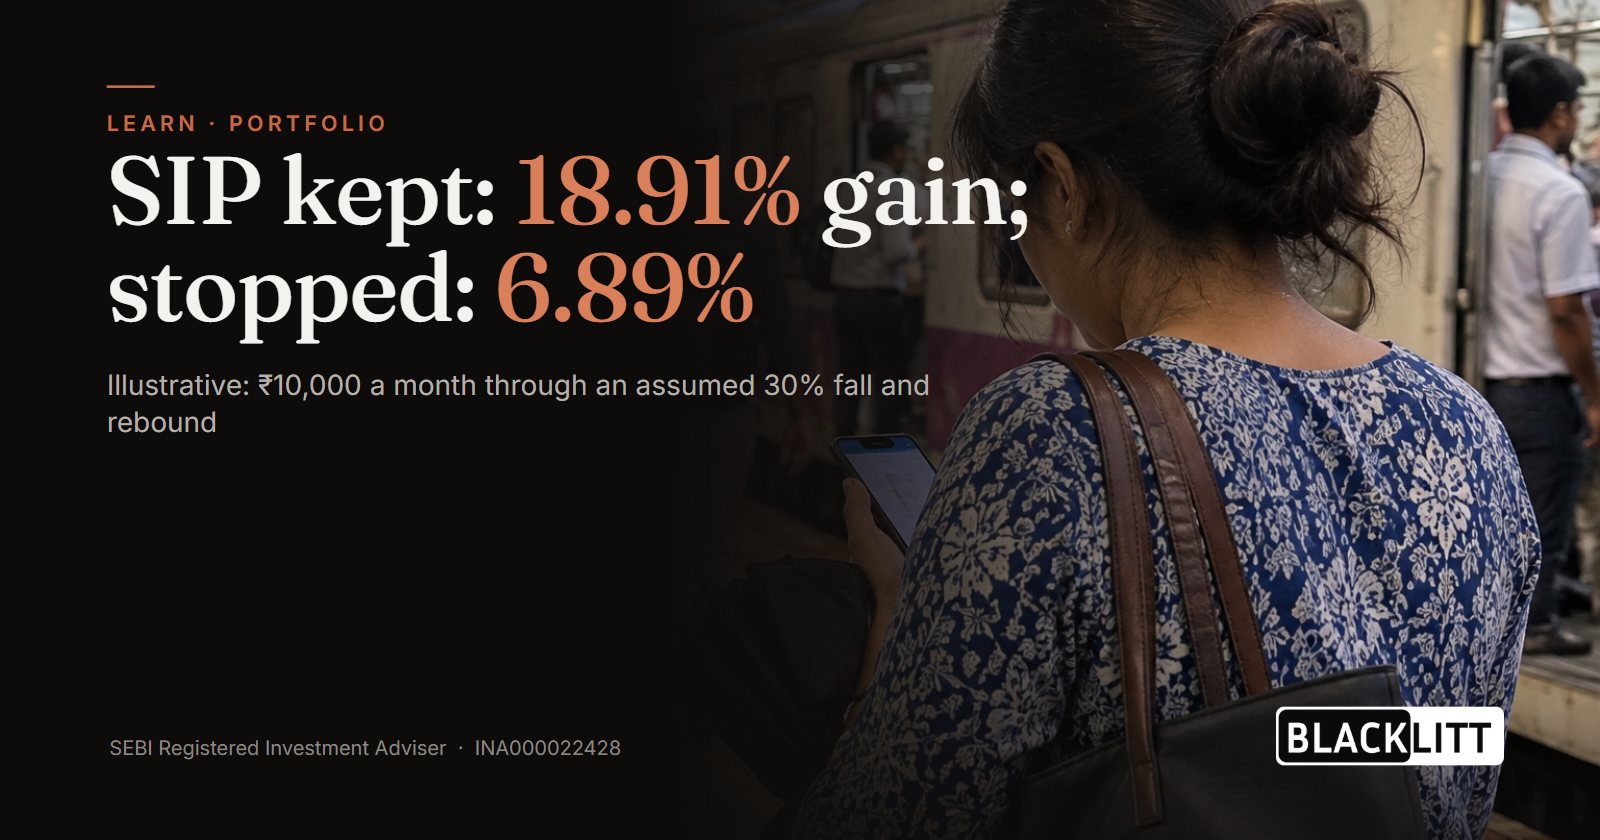
Usually, no. In a hypothetical market crash where prices fall 30% over a year and then recover, a SIP that kept running bought more units at low prices and ended with the highest value. Pausing or stopping meant fewer units when prices rebounded.
The example uses one simple price path, so treat it as a way to see the mechanics rather than a forecast. Real falls rarely unfold in straight lines, and the right choice also depends on your cash flow and goals.
A falling market tests SIP investors
A SIP buys a fixed rupee amount of units each month, so the number of units depends on the price that month. The NAV, or net asset value, is the price of one unit. When the NAV falls, the same instalment buys more units. That feature is what makes a SIP useful in a downturn, and it is also why stopping can feel like the cautious move. Stopping during a fall means giving up the cheaper units.
Falling prices also lower the value shown on your statement. That drop is easy to see and hard to ignore, which is why many investors pause at the bottom. The statement value and the units you have bought are different things, and the example below tracks the units.
A hypothetical 30% fall and recovery
The example assumes a NAV that starts at ₹100, falls in a straight line by 30% to ₹70 over 12 months, and then climbs back to ₹100 over the next 12 months. Real markets do not move like this. The simple path lets three SIP choices be compared on the same prices.
| Month | NAV (₹) |
|---|---|
| 0 | 100 |
| 6 | 85 |
| 12 | 70 |
| 18 | 85 |
| 24 | 100 |
Hypothetical NAV path. Illustrative figures only, not a real fund.
Continuing, pausing and stopping compared
The SIP is ₹10,000 at the start of each month, bought at that month's NAV. Three investors follow different rules:
- Continued: invests in all 24 months.
- Paused: invests in months 1 to 6, pauses in months 7 to 18, and resumes from month 19.
- Stopped: invests in months 1 to 6, then stops.
| Measure | Continued | Paused (months 7 to 18) | Stopped after month 6 |
|---|---|---|---|
| Instalments | 24 | 12 | 6 |
| Amount invested (₹) | 2,40,000 | 1,20,000 | 60,000 |
| Units allocated | 2,853.83 | 1,300.31 | 641.33 |
| Average cost per unit (₹) | 84.10 | 92.29 | 93.56 |
| Final value at NAV ₹100 (₹) | 2,85,383 | 1,30,031 | 64,133 |
| Gain (₹) | 45,383 | 10,031 | 4,133 |
| Gain on amount invested (%) | 18.91 | 8.36 | 6.89 |
Illustrative figures on the hypothetical path above. No taxes or costs. Gain percentages are measured on each scenario's own amount invested.
- Amount invested
- Final value
Illustrative figures on a hypothetical NAV path. No taxes or costs.
The continued SIP ends at ₹2,85,383 on ₹2,40,000 invested. The paused SIP ends at ₹1,30,031 on ₹1,20,000, and the stopped SIP ends at ₹64,133 on ₹60,000. Each one bought units at a different set of prices, and that is where the gap comes from.
Units bought during the fall do the work
The stopped investor's average cost is ₹93.56 because every instalment was made while the NAV was between ₹85 and ₹100. The continued investor's average cost is ₹84.10, because the instalments made during the fall, when the NAV reached ₹70, bought many more units.
The paused investor skipped the lowest prices in the middle of the path and bought again only after the NAV had climbed back. That is the cost of a pause: units that were never bought cannot share in the recovery.
Stopping a SIP in a market crash has a cost
After month 6, the stopped investor makes no new purchases, so the final ₹64,133 comes entirely from 641.33 units bought before the fall. The continued investor holds 2,853.83 units. Part of that rupee gap is simply the extra money the continued investor put in, so the fairer comparison is the gain: ₹45,383, or 18.91%, against ₹4,133, or 6.89%. The stopped investor keeps the uninvested cash, but that cash missed the cheapest units of the whole period.
Situations where stopping can make sense
The example shows the mechanics, not the right decision for every reader. Stopping or pausing can be reasonable when:
- the money is needed soon for an emergency or a near-term goal, since equity SIPs are not a place for emergency cash; see how to build an emergency fund with mutual funds;
- income has fallen and the instalment would strain the monthly budget;
- the fund has a problem of its own, such as persistent underperformance, which is different from a market-wide fall; see when your mutual fund underperforms;
- the goal or time horizon has changed.
For a wider checklist of steps during a fall, see what to do when the market crashes.
Limits of this example
The figures leave out taxes, exit loads and fund costs. The NAV moves in straight lines and recovers fully. If prices had stayed low for longer, or never returned to ₹100, continuing would still have bought units cheaply, but the final value would depend on where prices ended. The example does not show that outcome.
Frequently asked questions
Should I stop my SIP if the market crashes?
Not automatically. In the example, the investor who kept investing ended with the highest value. Stopping is worth considering when you need the money soon, your income has changed, or the fund itself has a problem rather than the market as a whole. A market-wide fall alone is not the same reason to stop.
Does a SIP buy more units when the NAV falls?
Yes. The same rupee amount divided by a lower NAV gives more units. That is why the investor who kept paying in during the fall ended with more units than the one who paused. The extra units pay off only if prices recover. If prices keep falling, those units lose value too, so the outcome depends on where prices end.
What happens to my units if I pause or stop?
Units you already own stay in your account and move with the market. Pausing or stopping does not sell them; it only ends future purchases. When you do sell, units are redeemed first in, first out, so the oldest instalments go first, and tax applies only at the point of sale.
Disclaimer
This article reflects the author's views as of 3 November 2026. Past performance does not indicate future returns. Examples that use assumed returns are for illustration only and are not projections. Consider your own goals and risk profile before investing.
Investment in securities market are subject to market risks. Read all the related documents carefully before investing.
The securities quoted are for illustration only and are not recommendatory.
Registration granted by SEBI, membership of BASL and certification from NISM in no way guarantee performance of the intermediary or provide any assurance of returns to investors.
Blacklitt Technologies Private Limited · SEBI RIA INA000022428 · BSE enlistment 2491