Expense Ratio in Mutual Funds: What It Is and What It Costs You
The expense ratio is the yearly fee a mutual fund charges, shown as a percentage of your investment. In a mutual fund, this expense ratio comes out of the fund's assets a little each day, so the NAV you see is already net of it. You never get a separate bill.
Mutual fund expense ratio explained
A fund needs money to run: fund management, administration and other operating costs. The expense ratio is the yearly total of those costs, expressed as a percentage of the assets in the fund. The total expense ratio (TER) is the all-in figure a fund reports for this charge.
Because the charge is taken daily, it sits inside the net asset value of the fund. A fund's NAV on any day already has the day's share of the expense ratio deducted, so the return you see is a return after cost. Regular plans also include distributor commission in this figure, which is covered below.
The charge sits inside your returns
The charge never appears as a line item in your account. Suppose you hold ₹1,00,000 in a fund with a 1% expense ratio. The charge is about ₹1,000 a year, or about ₹2.74 a day. These are illustrative figures, with the NAV assumed flat for simplicity.
Small daily amounts add up because the charge is taken every year from a balance that keeps growing or shrinking. That is why the difference between two ratios matters more over long periods than it first appears.
Rules on expense ratios from 1 April 2026
From 1 April 2026, the SEBI (Mutual Funds) Regulations, 2026 changed how the expense ratio is built. As of October 2026, it has three parts: a Base Expense Ratio (BER), brokerage on trades, and statutory levies and transaction costs charged at actual cost. The older single ratio with fixed slabs no longer applies.
The BER limit falls as a fund gets bigger, so larger funds have lower caps. The limits for open-ended schemes are below.
| Daily net assets slab | Equity-oriented BER (%) | Other than equity BER (%) |
|---|---|---|
| First ₹500 crore | 2.10 | 1.85 |
| Next ₹250 crore | 1.90 | 1.65 |
| Next ₹1,250 crore | 1.60 | 1.40 |
| Next ₹3,000 crore | 1.50 | 1.25 |
| Next ₹5,000 crore | 1.40 | 1.15 |
| Balance | 0.95 | 0.70 |
Data note: Limits as of October 2026, under the SEBI (Mutual Funds) Regulations, 2026. On the next ₹40,000 crore after these slabs, the limit falls by 0.05% for every ₹5,000 crore before the balance rate applies. These are ceilings, not the charge any fund actually levies.
Two more limits apply. Index funds and ETFs are capped at 0.90%. Brokerage sits on top of the BER, at most 0.06% of trade value for cash trades and 0.02% for derivatives.
Cost of the expense ratio over 20 years
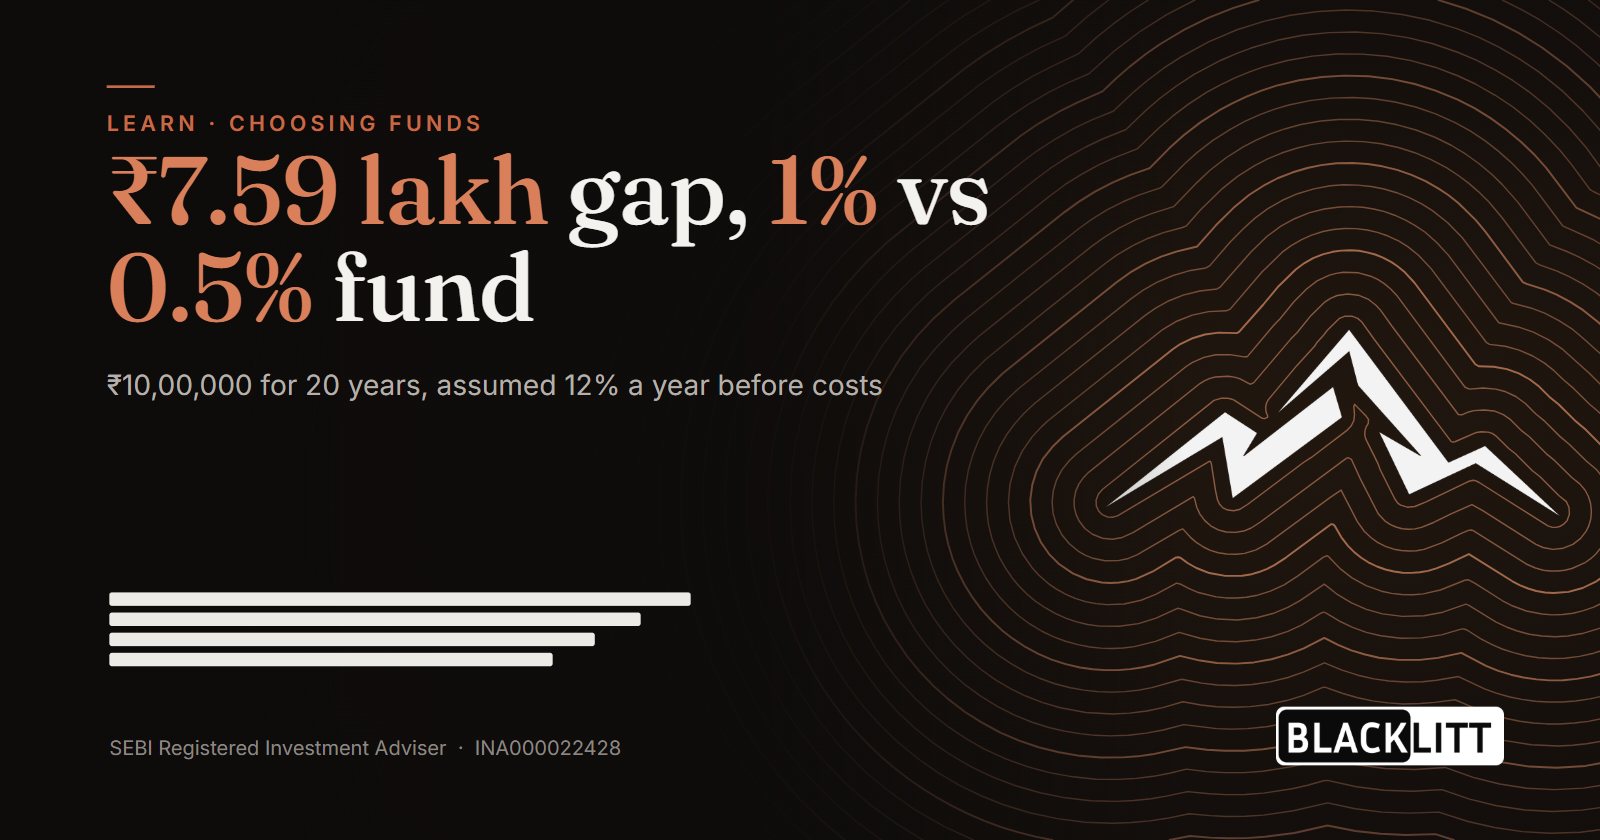
Suppose ₹10,00,000 is invested once, and the portfolio earns an assumed 12% a year before costs. The values below are after each expense ratio.
| Expense ratio (%) | Value after 10 years (₹ lakh) | Value after 20 years (₹ lakh) | Shortfall vs 0.5% after 20 years (₹ lakh) |
|---|---|---|---|
| 0.5 | 29.70 | 88.21 | 0.00 |
| 1.0 | 28.39 | 80.62 | 7.59 |
| 1.5 | 27.14 | 73.66 | 14.55 |
| 2.0 | 25.94 | 67.27 | 20.94 |
Data note: Illustrative figures at an assumed 12% a year before costs. Shortfall is measured against the 0.5% fund.
Illustrative: ₹10,00,000 invested once, assumed 12% a year before costs.
The 1% fund ends about ₹7.59 lakh below the 0.5% fund after 20 years, and the 2% fund about ₹20.94 lakh below. Nothing in the fund changed to cause this gap. The difference is the yearly charge compounding against you.
Direct and regular plans carry different ratios
Every mutual fund scheme is offered as a Direct plan and a Regular plan. The portfolio is the same, but a Regular plan pays a distributor commission out of the expense ratio, so its ratio is higher. A Direct plan carries no distributor commission, so its ratio is lower. Over long periods, that gap compounds in the same way as the table above. The difference between the two plans is worth checking before you invest.
Judging an expense ratio fairly
There is no single number that makes an expense ratio good. Judge it against the fund's peers and its results instead.
| Check | What to look for |
|---|---|
| Same category | Compare funds within one SEBI category, such as Large Cap with Large Cap. A cheap Small Cap fund and an expensive Large Cap fund do not answer the same question. |
| Index alternative | Set an actively managed fund against an index fund that tracks the same market. The gap shows what you pay for active management. |
| Returns after costs | Returns quoted for a fund are already net of the expense ratio. Compare 3- and 5-year returns against the category, not only the ratio. |
| Same plan type | Compare Direct plans with Direct plans. A Regular plan carries a higher ratio for the same portfolio, so mixing plan types distorts the comparison. |
A fund with a lower ratio can still lag its category, and a higher-cost fund can deliver more after costs. Treat the expense ratio as one input alongside consistency, mandate and the fund's size.
Frequently asked questions
Is a lower expense ratio always better?
Usually cost matters, but not alone. A lower expense ratio keeps more of the return in your pocket. Yet a cheap fund can still lag its category if its strategy or stock selection is weak, so compare cost and after-cost returns together.
Do I pay the expense ratio separately?
The expense ratio is not billed separately. It is deducted from the fund's assets every day, so the NAV already reflects it. You feel its effect only through the fund's returns, which are already shown after the charge, so there is nothing extra to pay.
What is the difference between TER and expense ratio?
They refer to the same charge. TER, or total expense ratio, is the all-in figure a fund reports. Since 1 April 2026, it is built from the base expense ratio, brokerage and statutory levies, each capped or charged at actual cost under the rules described above.
Why do index funds have lower expense ratios?
An index fund copies a benchmark rather than choosing stocks, so it needs less research and fewer trades. The rules from 1 April 2026 cap index funds and ETFs at 0.90%.
Disclaimer
This article reflects the author's views as of 28 October 2026. Past performance does not indicate future returns. Examples that use assumed returns are for illustration only and are not projections. Consider your own goals and risk profile before investing.
Investment in securities market are subject to market risks. Read all the related documents carefully before investing.
The securities quoted are for illustration only and are not recommendatory.
Registration granted by SEBI, membership of BASL and certification from NISM in no way guarantee performance of the intermediary or provide any assurance of returns to investors.
Blacklitt Technologies Private Limited · SEBI RIA INA000022428 · BSE enlistment 2491